Bitcoin investors are witnessing remarkable market patterns as the cryptocurrency demonstrates uncanny similarities to previous Q2 behavior, with the Coinbase Premium flipping green signaling potential recovery. This development comes amid significant market volatility and substantial liquidations, offering crucial insights for traders and institutional investors alike.
Bitcoin Q2 Dip Patterns Show Striking Resemblance
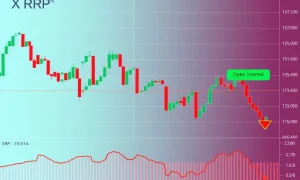
Market analysts are observing extraordinary parallels between current Bitcoin price action and previous Q2 movements. Consequently, the cryptocurrency market appears to be following established historical patterns. Specifically, BTC/USD recently tested support levels around $108,717, mirroring behavior seen in June when prices dropped from all-time highs.
Cas Abbe, a CryptoQuant contributor, emphasizes the remarkable similarities. “BTC chart resemblance to Q2 2025 fractal is uncanny,” he noted. Furthermore, the current market structure shows identical lower-lows and capitulation patterns that previously signaled market bottoms.
Coinbase Premium Signals US Demand Recovery
The Coinbase Premium Index has returned to positive territory, indicating strengthening US market demand. This crucial metric measures price differences between Coinbase and Binance trading pairs. Importantly, green readings typically suggest increased institutional and retail interest from American investors.
Popular trader BitBull confirms the significance of this development. “Coinbase Bitcoin Premium turned positive during bottom and long liquidations were huge,” he stated. Additionally, this combination often precedes short-term rallies and market recoveries.
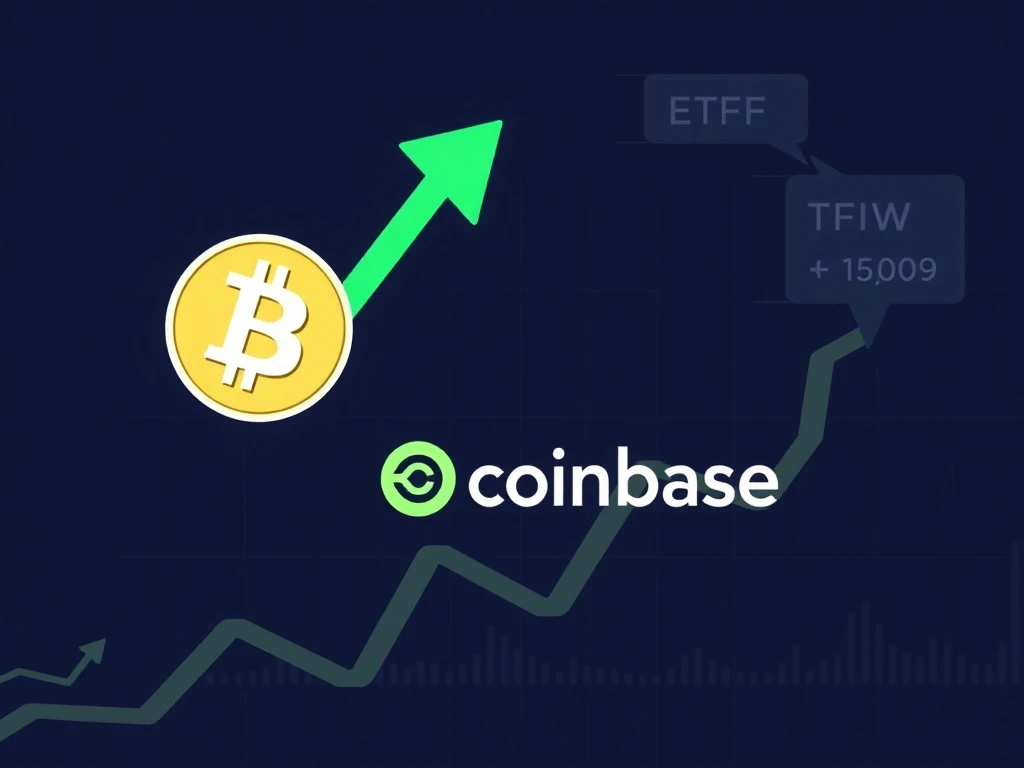
ETF Flows Defy Market Expectations
US spot Bitcoin ETFs surprisingly achieved positive flows despite recent market weakness. According to Farside Investors data, Monday saw nearly $220 million in net inflows. This development contradicts the broader market sentiment and suggests underlying institutional confidence.
Analysts from Ecoinometrics highlight the connection between macro uncertainty and ETF performance. “The macro uncertainty of the past few weeks is showing up directly in the flows,” they observed. However, recent positive flows indicate potential sentiment shift.
Market Liquidation and Technical Analysis
Recent market movements triggered substantial liquidations exceeding $700 million within 24 hours. This cleansing of leveraged positions typically creates healthier market conditions. Technical analysts now watch key support levels between $106,000 and $108,000 for potential bounce opportunities.
BitBull maintains cautious optimism about near-term prospects. “There is still a chance of $106K-$108K level retest, but for now I’m expecting a bounceback,” he commented. Meanwhile, other traders anticipate short squeezes due to concentrated short positioning above $115,000.
Institutional Sentiment and Market Outlook
Institutional players continue monitoring the Bitcoin Q2 dip for strategic entry points. The combination of positive Coinbase Premium and ETF flows creates compelling fundamentals. Moreover, historical patterns suggest current conditions might present attractive risk-reward opportunities.
Market participants should note that similar Q2 patterns previously preceded significant rallies. However, traders must remain vigilant about potential support tests and manage risk appropriately during volatile periods.
Frequently Asked Questions
What is the Coinbase Premium Index?
The Coinbase Premium Index measures price differences between BTC/USD on Coinbase and BTC/USDT on Binance, indicating US market demand strength.
How significant are the Bitcoin Q2 dip similarities?
Analysts describe the similarities as “uncanny” with nearly identical chart patterns and market structure developments compared to previous Q2 periods.
What do positive ETF flows indicate?
Positive ETF flows suggest institutional confidence despite market volatility, often preceding broader market recoveries.
Should investors expect further downside?
While some analysts anticipate potential support tests around $106,000-$108,000, many expect near-term bounces given current indicators.
How do liquidations affect market recovery?
Large liquidations remove excess leverage from the market, creating healthier conditions for sustainable price movements.
What time frame do analysts monitor for recovery signals?
Tradtypically watch 4-hour and daily charts for confirmation of trend changes and recovery patterns.