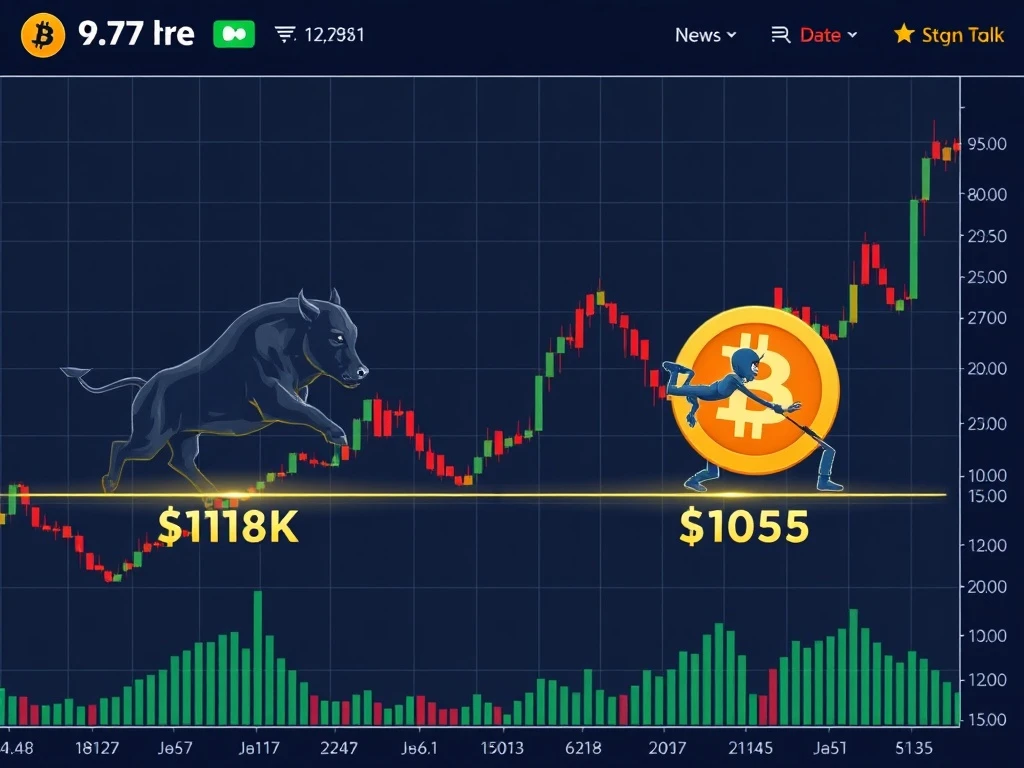
Bitcoin stands at a crucial juncture as traders grapple with conflicting signals between aggressive retail buying and persistent whale selling. The cryptocurrency’s recent volatility has created two distinct possibilities: a swift reversal toward $118,000 or another painful drop to $105,000. Market data reveals a fascinating battle between different investor classes that will determine Bitcoin’s next major move.
Current Bitcoin Price Battle: Retail vs Institutional Forces
Bitcoin currently trades in a tight range after recovering from Monday’s lows. The cryptocurrency shows a mere 2.4% bounce from its $108,665 bottom, significantly underperforming Ether’s 8.26% recovery. This divergence highlights the unique pressure facing Bitcoin’s price movement. Retail traders aggressively accumulated positions during the recent dip, particularly in the 1K to 10K transaction cohort.
Meanwhile, whale and institutional-sized traders (1 million to 10 million) maintained net selling positions throughout the correction period. The selling intensity notably decreased as Bitcoin reclaimed the $111,000 support level. This creates a fascinating market dynamic where smaller investors provide buying support while larger players continue distributing assets.
Exchange Data Reveals Clear Divergence
Granular analysis of cumulative volume delta data shows distinct behavior patterns across exchanges. Retail traders on Binance’s spot and perpetual futures markets consistently opened long positions during the dip. Conversely, institutional-sized traders maintained net selling activity across major platforms.
Key findings from exchange data:
- Coinbase retail traders recorded $101.253 million in net buying
- Institutional cohorts at Coinbase and Binance remained net sellers
- Perpetual futures markets saw approximately $7.5 billion in selling pressure
- Retail traders consistently bought throughout the correction period
Liquidation Levels and Price Targets
Hyblock’s liquidation heatmap data identifies critical support and resistance clusters. The $111,000 to $110,000 zone absorbed significant buying interest during the weekend sell-off. Another substantial liquidity cluster exists near $104,000, creating a potential downside target if selling pressure intensifies.
While a breakdown to the $104,000 level seems less probable currently, the imbalance between large-order selling and retail buying continues creating downward pressure. Traders should monitor the anchored aggregated daily CVD for signs of changing sentiment among larger investors.
Market Sentiment and Technical Outlook
Despite retail optimism, Bitcoin remains trapped in a short-term downtrend. The positive smaller-order CVD data from Binance and Coinbase hasn’t translated into meaningful price recovery yet. This discrepancy suggests that whale selling continues overwhelming retail buying enthusiasm.
Critical factors to watch:
- Anchored cumulative volume delta trends
- Institutional selling pressure indicators
- Liquidation cluster reactions at key levels
- Market sentiment alignment with volume data
Potential Scenarios and Probability Assessment
The $118,000 retest scenario depends heavily on whale selling pressure subsiding. If institutional distribution slows and retail accumulation continues, a mean reversion toward previous highs becomes increasingly likely. However, sustained large-order selling could push Bitcoin toward testing the $105,000 support level.
Traders should prepare for both possibilities while monitoring volume data for early signals. The current market structure suggests continued volatility with defined support and resistance levels providing clear trade setups.
Frequently Asked Questions
What is causing Bitcoin’s current price pressure?
Bitcoin faces downward pressure primarily from institutional and whale selling overwhelming retail buying support. Despite strong retail accumulation, larger order distribution maintains downward momentum.
How likely is a drop to $105,000?
While possible, a drop to $105,000 appears less probable currently based on liquidation heatmap data. The $111,000-$110,000 zone provides stronger support, though continued whale selling could test lower levels.
What signals would indicate a reversal to $118,000?
A reversal would require decreased institutional selling pressure, sustained retail accumulation, and breaking key resistance levels. Monitoring CVD data and liquidation levels provides early reversal signals.
How are retail traders positioned currently?
Retail traders show strong accumulation patterns with net buying across spot and futures markets. Data indicates consistent dip-buying behavior despite the ongoing downtrend.
What time frame should traders watch for resolution?
The current battle between buyer and seller cohorts should resolve within 1-2 weeks. Daily CVD data and liquidation level reactions provide the clearest short-term direction signals.
How does Ether’s performance affect Bitcoin?
Ether’s stronger recovery suggests some capital rotation away from Bitcoin. However, Bitcoin typically leads market movements, making its price action more significant for overall market direction.
This analysis contains no investment advice or recommendations. All trading involves risk, and readers should conduct independent research before making decisions.