The FLUX cryptocurrency has experienced a devastating 70.25% price collapse over the past month, plunging to $0.1956 amid severe technical deterioration and vanishing buy pressure. This dramatic decline represents one of the most significant cryptocurrency crashes of the quarter, leaving investors and analysts searching for answers.
FLUX Cryptocurrency Technical Breakdown
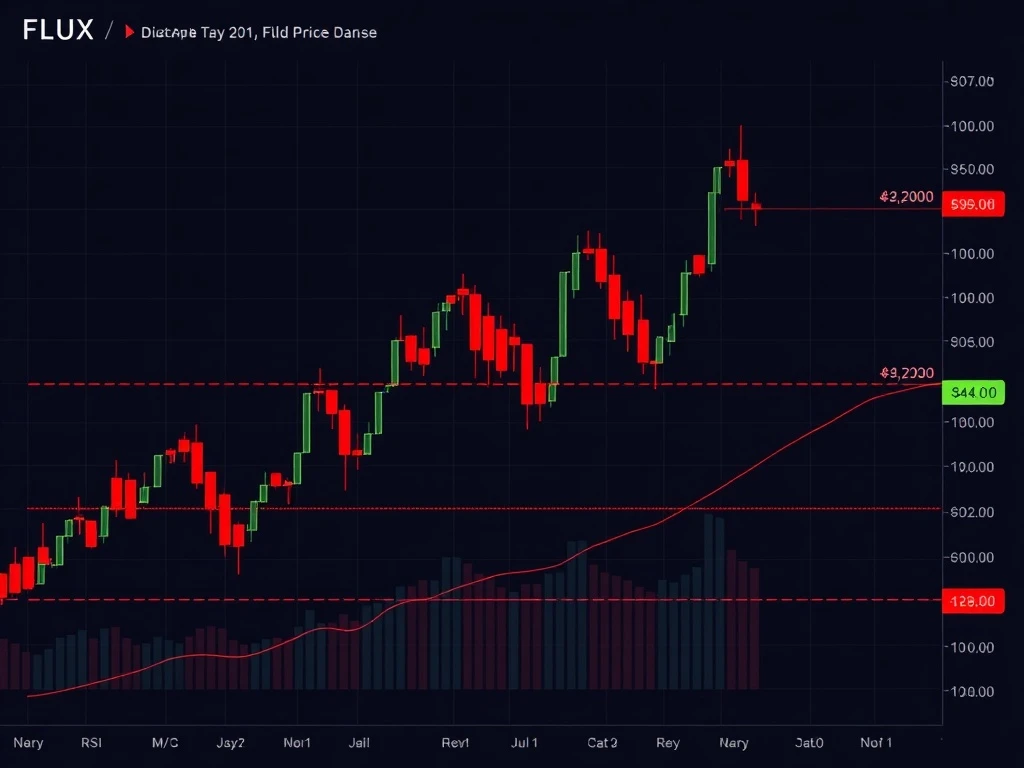
FLUX cryptocurrency technical indicators paint a consistently bearish picture. The token dropped 15.14% within 24 hours on September 1, 2025, accelerating the monthly decline. Key technical levels have broken down completely:
- RSI below 30 indicating severely oversold conditions
- MACD in negative territory with bearish crossover patterns
- Price trading below both 50-day and 200-day moving averages
- Breakdown of multiple psychological support levels
Market Dynamics and Buy Pressure Collapse
The FLUX cryptocurrency decline coincides with dramatically reduced market participation. Short-term traders have been locking in profits while institutional buyers remain absent. This created a perfect storm of selling pressure without corresponding buy interest. Market sentiment has shifted decisively risk-off, particularly affecting altcoins like FLUX cryptocurrency.
Technical Analysis and Indicator Signals
Technical analysis reveals consistent bearish momentum across multiple timeframes. The FLUX cryptocurrency RSI reading below 30 typically suggests oversold conditions, but in this case, it has failed to provide support. Similarly, the MACD indicator remains firmly in negative territory, reinforcing the downward trajectory. These technical signals suggest further declines may occur before stabilization.
Backtesting Strategy for Potential Reversal
Analysts propose a specific backtesting strategy to identify potential FLUX cryptocurrency trend reversals. This approach requires three confirmation signals:
- Bullish candlestick reversal pattern formation
- RSI crossover above the 30 threshold
- Sustained close above the 50-day moving average
The strategy aims to capture trend resumption rather than short-term volatility, making it suitable for FLUX cryptocurrency’s current market conditions.
Market Outlook and Key Levels
The FLUX cryptocurrency faces critical resistance at the $0.20 level. Analysts warn that without a strong reversal above this threshold, further declines appear likely. The token may need to stabilize near Fibonacci retracement levels before any meaningful recovery can occur. Current market conditions suggest continued caution for FLUX cryptocurrency investors.
Frequently Asked Questions
What caused FLUX’s 70% price drop?
The decline resulted from combined technical breakdown, reduced buy pressure, and overall risk-off sentiment in cryptocurrency markets. Technical indicators showed consistent bearish momentum throughout August 2025.
Is FLUX oversold according to RSI?
Yes, the RSI below 30 indicates oversold conditions. However, oversold readings can persist during strong downtrends, so this alone doesn’t guarantee immediate reversal.
What price level could signal recovery?
Analysts identify $0.20 as critical resistance. A sustained break above this level with volume could indicate potential trend reversal for FLUX.
How reliable are the proposed backtesting signals?
The three-signal approach (bullish pattern, RSI crossover, moving average break) aims to reduce false signals but requires confirmation across multiple timeframes for reliability.
Should investors consider buying the dip?
Current technical analysis suggests caution. While oversold, the strong downtrend and lack of buy pressure indicate possible further declines before stabilization.
What timeframes show the strongest bearish signals?
Daily and weekly charts show the most consistent bearish momentum, with breakdowns occurring across multiple technical indicators and timeframes.