
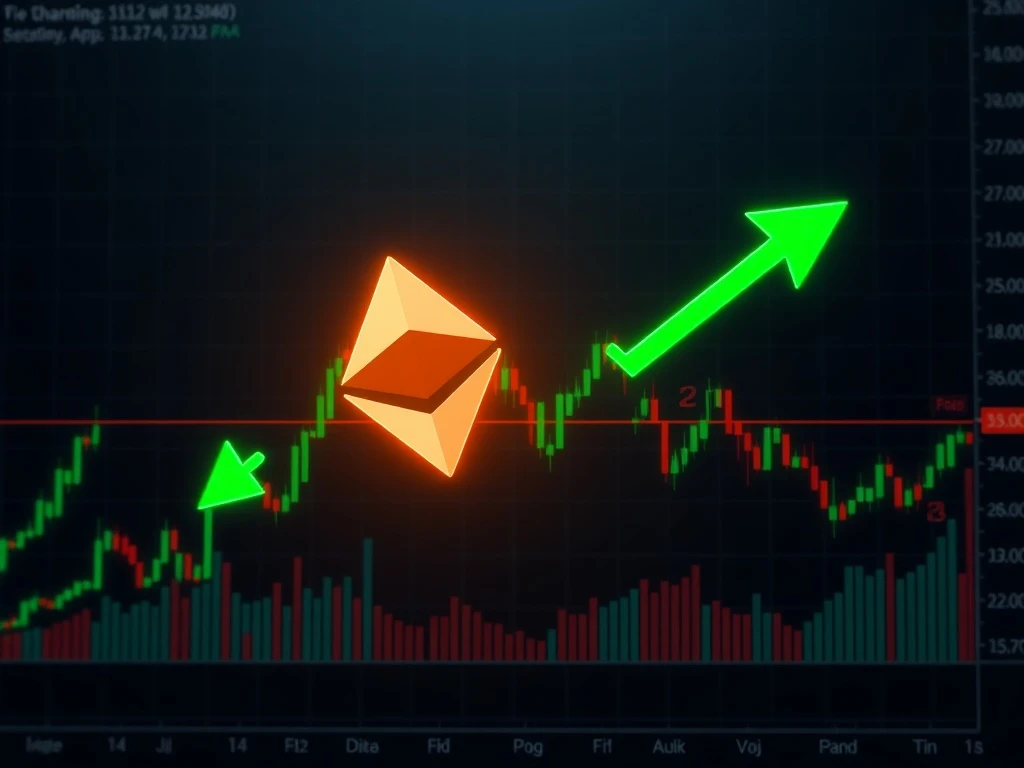
Ethereum traders face a critical September scenario as analysts warn of an impending bear trap that could shake out weak positions before launching a dramatic recovery. This potential market maneuver mirrors historical patterns while presenting unique opportunities for informed investors.
Ethereum Technical Analysis Reveals Bear Trap Pattern
Technical analysts identify a developing head-and-shoulders pattern that suggests Ethereum may experience significant downward pressure. Johnny Woo, a full-time crypto trader, emphasizes this setup could trigger panic selling among inexperienced traders. Consequently, the market might test the $3,350 support level before reversing course. Moreover, this pattern resembles September 2021’s correction that preceded November’s all-time high achievement.
Key Support Levels and Moving Average Breakdown
Ethereum currently consolidates between $4,300 and $4,500, creating uncertainty among market participants. A break below the four-hour 200 moving average could accelerate declines toward critical support zones. Traders should monitor the $4,160 level closely as it represents a crucial technical threshold. Additionally, the asset shows lower highs and lower lows, indicating ongoing consolidation phase dynamics.
Fundamental Analysis Contrasts Technical Predictions
Fundamental analysts approach the Ethereum bear trap scenario differently, emphasizing macroeconomic factors over chart patterns. Henrik Andersson of Apollo Capital cautions against over-reliance on historical technical formations. Similarly, Gracie Lin from OKX Singapore highlights stablecoin growth and regulatory developments as primary long-term drivers. These experts believe macroeconomic events including Federal Reserve decisions will influence short-term volatility more than technical patterns.
Market Psychology and Trader Behavior Patterns
The potential Ethereum bear trap represents more than just price movement—it tests trader psychology and risk management strategies. Market veterans recognize these patterns as opportunities while newcomers often react emotionally. Successful navigation requires understanding both technical signals and fundamental underpinnings. Furthermore, historical data shows September typically presents challenges for cryptocurrency markets.
Current Market Position and Recovery Indicators
Ethereum trades at $4,374 after reaching an intraday low of $4,238, showing resilience despite recent pressures. The asset remains 11.7% below its all-time high, presenting a relatively modest pullback compared to previous corrections. Market analysts observe that this consolidation phase could establish a strong foundation for future growth. Technical indicators suggest the current movement aligns with healthy market cycle behavior.
Long-Term Growth Drivers Beyond Price Fluctuations
Beyond short-term volatility, Ethereum’s value proposition remains strong due to several fundamental factors. The network continues seeing increased stablecoin adoption and DeFi activity. Regulatory clarity developments also provide stronger foundation for institutional participation. Additionally, Ethereum’s ecosystem expansion through layer-2 solutions enhances its scalability and utility propositions.
Risk Management Strategies for Traders
Professional traders recommend specific approaches during potential bear trap scenarios:
• Maintain position sizing discipline
• Set stop-loss orders at logical technical levels
• Monitor macroeconomic calendar events
• Diversify across timeframes and strategies
• Focus on long-term fundamentals rather than short-term noise
Historical Precedents and Pattern Recognition
September 2021’s Ethereum movement provides valuable insights for current market conditions. The asset dropped from $3,950 to $2,750 before achieving new highs in November. This pattern repetition suggests market cycle consistency despite different macroeconomic environments. Analysts note that recognizing these historical parallels helps inform better trading decisions during volatile periods.
Expert Consensus and Diverging Viewpoints
Market experts present balanced perspectives on the Ethereum bear trap possibility. Technical analysts emphasize chart patterns and historical data while fundamental analysts focus on macroeconomic drivers. This diversity of opinion reflects cryptocurrency market maturity and analytical sophistication. Investors benefit from considering multiple viewpoints before making trading decisions.
FAQs
What is an Ethereum bear trap?
An Ethereum bear trap occurs when prices drop significantly, convincing traders of a bearish trend, before reversing sharply upward and trapping short sellers.
How low could Ethereum drop in September?
Analysts predict potential support around $3,350 based on technical analysis and historical pattern projections.
When might Ethereum recover from September lows?
Most analysts project October rebound potential following September pressure, with possible new highs by November.
Should traders rely on technical or fundamental analysis?
Experts recommend combining both approaches since technical patterns provide entry points while fundamentals determine long-term value.
What macroeconomic events could affect Ethereum?
Federal Reserve rate decisions, U.S. jobs data, and regulatory announcements significantly impact cryptocurrency markets including Ethereum.
How does current volatility compare to historical patterns?
Current 11.7% pullback from all-time highs appears moderate compared to previous September corrections, suggesting relatively stable market conditions.
