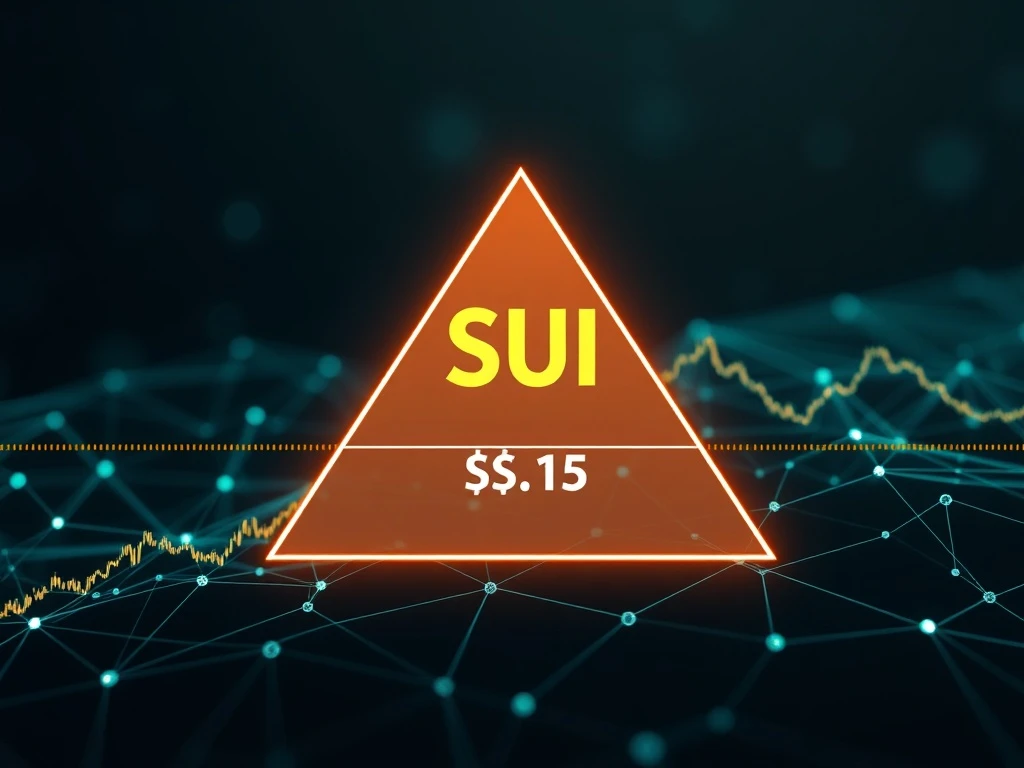
SUI traders face a decisive moment as the cryptocurrency tests crucial support at $3.15. This technical juncture could determine whether SUI experiences a massive 3x rally or faces significant downward pressure. Market participants closely monitor this key level amid high open interest and mixed technical indicators.
Technical Pattern and SUI Support Analysis
SUI currently forms a descending triangle pattern near the $3.15–$3.20 support zone. This classic technical formation often precedes significant volatility events. Analysts identify this level as critical for buyer defense. Repeated testing suggests accumulation activity from strategic investors. However, failure to hold this SUI support could trigger substantial selling pressure.
Market Indicators and Trading Activity
Open interest across major exchanges totals $780 million, indicating intense speculative interest. Binance leads with $344 million in positions, followed by Bybit at $252 million. Technical indicators show market equilibrium with RSI at 43 and MACD near neutral. The 6.66% weekly decline contrasts with robust $11.8 billion market capitalization. This divergence creates tension for the crucial SUI support test.
Fundamental Developments Supporting SUI
Recent partnerships strengthen SUI’s fundamental case. The Alibaba Cloud AI Coding Assistant collaboration attracts developer attention. AI-driven DeFi protocol integrations enhance network utility. These developments provide underlying strength during the current SUI support challenge. Institutional participation continues growing despite recent price pressure.
Risk Management Considerations
Traders must implement strict risk management around this key SUI support level. Position sizing should account for potential high volatility. Stop-loss orders below $3.15 could protect against breakdown scenarios. Conversely, breakout above triangle resistance might confirm upward momentum. Monitoring volume patterns provides additional confirmation signals.
FAQs
What happens if SUI breaks below $3.15 support?
A breakdown could trigger stop-loss orders and accelerate selling pressure, potentially testing lower support levels around $2.80–$3.00.
What technical indicators confirm SUI support holding?
Watch for increasing volume on bounces, RSI moving above 50, and MACD turning positive alongside price holding above $3.15.
How long has this descending triangle pattern developed?
Analysts note the pattern has formed over several weeks, approaching its apex where volatility typically increases significantly.
What fundamental factors support SUI’s long-term value?
Partnerships with major cloud providers, AI integration developments, and growing DeFi ecosystem provide fundamental support beyond technical levels.
What exchange shows highest SUI trading activity?
Binance dominates SUI derivatives with $344 million open interest, followed by Bybit at $252 million, indicating broad market participation.
What price targets exist if SUI holds support?
Analysts project potential moves toward $5.00 initially, with longer-term targets near $10.00 if bullish momentum accelerates.