Cryptocurrency traders seeking profitable opportunities should closely examine the SANTOSBTC trading pair, which recently displayed fascinating technical patterns and consolidation signals that could indicate significant upcoming price movements.
SANTOSBTC Price Action and Key Levels
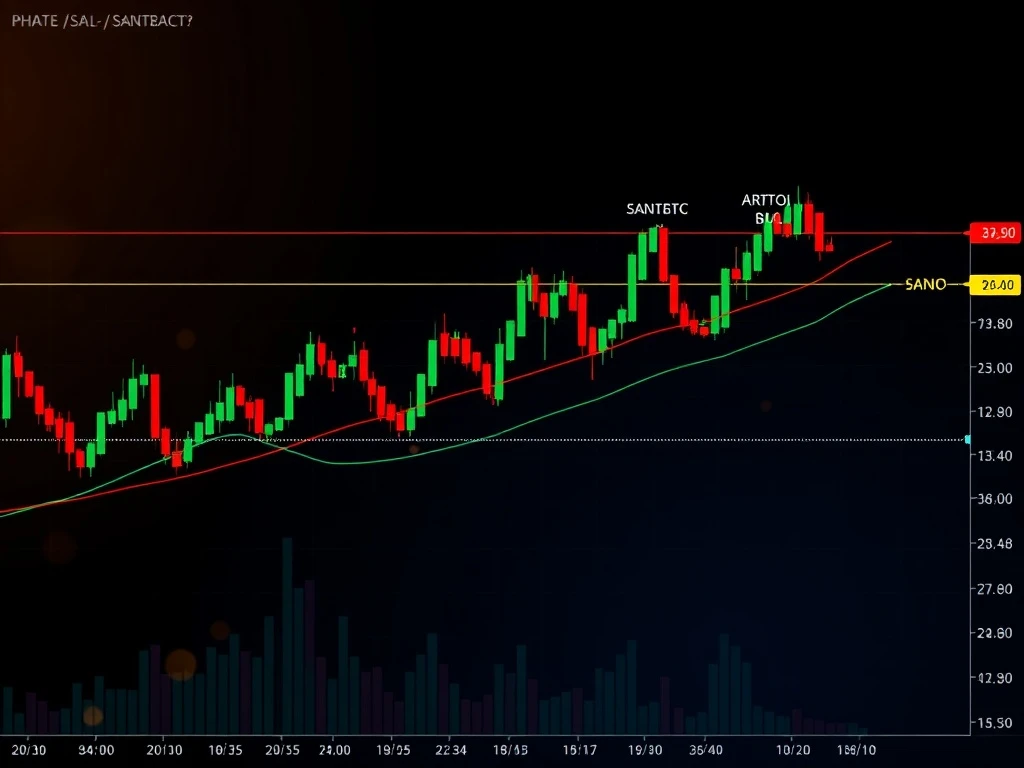
The SANTOSBTC pair demonstrated notable price behavior throughout the trading session. Specifically, the asset traded between 1.574e-05 and 1.608e-05 over 24 hours, ultimately closing at 1.599e-05. This range-bound activity suggests market indecision while establishing critical support and resistance levels. Furthermore, the price action revealed several important technical developments:
- Fibonacci retracement levels provided significant support at 1.593e-05
- Resistance firmly established at 1.603e-05
- Consolidation near psychological price points
- Low-volume trading conditions throughout most sessions
Technical Indicators and Market Momentum
Technical analysis of SANTOSBTC reveals crucial insights for traders. The RSI indicator hovered between 45 and 55, indicating neutral market momentum without extreme conditions. Meanwhile, the MACD showed neutral readings with occasional line crossings that suggested potential short-term reversals. Additionally, Bollinger Bands contracted significantly, typically preceding substantial price breakouts. Key observations include:
- RSI maintained neutral territory throughout the session
- MACD crossovers provided early reversal signals
- Contracting Bollinger Bands indicated impending volatility expansion
- Moving averages remained closely aligned, confirming sideways momentum
Volume Analysis and Market Sentiment
Trading volume patterns offered critical insights into market sentiment. Volume spiked dramatically during the morning rally, particularly between 04:15 and 04:30 ET, with over 354.58 contracts traded. However, volume subsequently dropped significantly, with several 15-minute intervals recording zero activity. This divergence between price movement and volume suggests cautious market participation. Important volume characteristics included:
- Morning volume surge accompanied the price rally
- Subsequent volume decline indicated lack of conviction
- Notional turnover reached approximately 56.31
- Volume-price divergence signaled potential reversal patterns
Trading Strategies and Backtesting Opportunities
Professional traders can develop effective strategies based on the observed SANTOSBTC patterns. A potential approach involves entering long positions on bullish reversal patterns confirmed by volume expansion. This strategy would implement stop losses below recent swing lows around 1.58e-05 and take profit targets at Fibonacci resistance levels. Key strategy components include:
- Entry triggers based on volume-confirmed reversals
- Stop loss placement below key support levels
- Profit targets at identified resistance points
- RSI divergence confirmation for trade validation
Market Outlook and Future Projections
The SANTOSBTC market currently exhibits characteristics typical of consolidation phases before significant moves. The constricting Bollinger Bands, combined with neutral momentum indicators, suggest an impending volatility expansion. Traders should monitor volume patterns closely, as increased participation will likely confirm the direction of the next major move. Critical factors to watch include:
- Breakouts above 1.608e-05 or below 1.574e-05
- Volume confirmation of price movements
- Fibonacci level reactions for support and resistance
- Momentum indicator divergences for early signals
Frequently Asked Questions
What is SANTOSBTC?
SANTOSBTC represents the trading pair between Santos FC Fan Token and Bitcoin, allowing traders to exchange the football club’s fan token against the leading cryptocurrency.
What do contracting Bollinger Bands indicate?
Contracting Bollinger Bands typically signal decreased volatility and often precede significant price breakouts in either direction.
How important is volume confirmation in SANTOSBTC trading?
Volume confirmation remains crucial for validating price movements, as low-volume moves often lack sustainability and may reverse quickly.
What Fibonacci levels are most significant for SANTOSBTC?
The 61.8% Fibonacci retracement level often acts as critical support or resistance, as demonstrated in recent SANTOSBTC price action.
How can traders use RSI effectively with SANTOSBTC?
Traders should watch for RSI divergences and movements outside the 30-70 range for potential overbought or oversold conditions.
What timeframes work best for SANTOSBTC analysis?
Multiple timeframe analysis proves most effective, combining 15-minute charts for entry timing with daily charts for overall trend direction.