Bitcoin investors face mounting concerns as multiple technical indicators flash warning signs in August 2025. The cryptocurrency’s price action reveals concerning patterns that suggest potential significant downside movement. Market analysts closely monitor key support levels that could determine Bitcoin’s near-term trajectory.
Technical Indicators Show Bitcoin Bearish Signals Intensifying
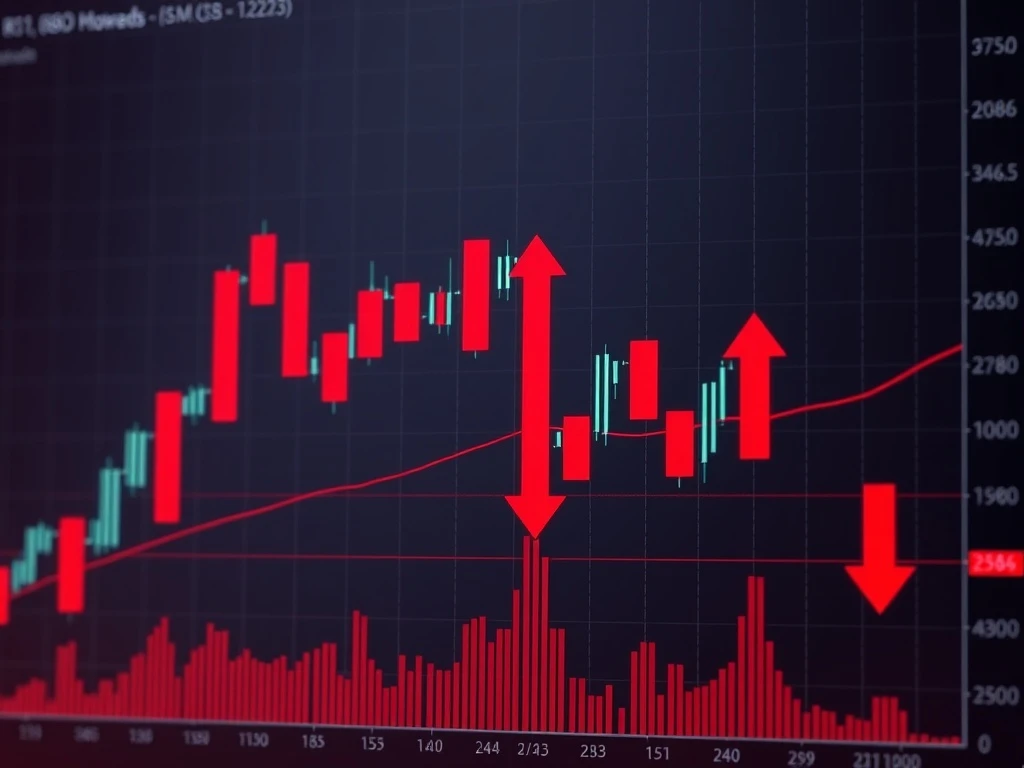
Bitcoin’s technical landscape presents concerning developments that traders cannot ignore. The Relative Strength Index dropped below 50 on weekly charts, indicating weakening bullish momentum. Meanwhile, the Moving Average Convergence Divergence formed a bearish crossover pattern. These Bitcoin bearish signals historically precede substantial price corrections. Price consolidation below the $107K–$108K range further confirms seller dominance. Market participants observe ascending wedge and descending parallel channel formations. Both patterns typically signal bearish continuation scenarios.
Critical Support Levels Under Pressure
Immediate support levels face intense scrutiny as selling pressure mounts. The $107K and $108K thresholds represent crucial psychological barriers. However, the 200-day Simple Moving Average around $101,306 provides stronger technical support. A breakdown below $107K could trigger accelerated selling toward $100K. Further deterioration might test the $97.5K support zone. These Bitcoin bearish signals highlight the vulnerability of current price levels. Long-term holders monitor these developments carefully for potential entry opportunities.
On-Chain Metrics Confirm Bitcoin Bearish Signals
On-chain data reinforces the technical analysis showing concerning trends. The MVRV ratio fell below its 365-day simple moving average. This indicates widespread undervaluation across the network. Short-term holders show signs of potential capitulation under current conditions. The 30-day MVRV rate registers at -3.37%, demonstrating prolonged underperformance. These metrics suggest Bitcoin’s price may not fully reflect macroeconomic pressures. The convergence of on-chain and technical Bitcoin bearish signals creates a compelling risk narrative.
Macroeconomic Factors Amplifying Bitcoin Bearish Signals
External economic conditions exacerbate the technical deterioration. Substantial ETF outflows totaling $2 billion from Bitcoin products occurred in August. Gold ETFs simultaneously experienced $449 million in outflows. This synchronized movement reflects broad investor uncertainty. Conflicting U.S. economic data creates additional market confusion. Rising core CPI and PPI inflation contrast with softening labor market numbers. Federal Reserve policy ambiguity further destabilizes market sentiment. Chair Jerome Powell’s mixed messaging compounds existing uncertainty.
Geopolitical Risks and Market Volatility
Geopolitical developments contribute to increased market turbulence. Research indicates country-specific shocks elevate crypto exchange rate premiums. However, global geopolitical acts cause persistent premium declines. This dynamic reflects heightened risk aversion during realized events. Bitcoin’s role as a capital flight medium faces challenges under current conditions. The asset’s market dominance slipped to 59% as capital shifts toward altcoins. Ethereum and Solana particularly benefit from this capital rotation.
Strategic Considerations for Investors
Despite concerning Bitcoin bearish signals, strategic opportunities may emerge. The 200-day SMA around $101K could provide potential entry points. Long-term investors might find value near these technical support levels. However, caution remains necessary given current market conditions. Without policy clarity or sentiment shift, lower targets remain possible. Investors should monitor key developments including:
• Federal Reserve policy decisions regarding rate cuts
• ETF flow patterns and institutional sentiment
• On-chain metric developments and holder behavior
• Geopolitical event impacts on risk assets
Market Outlook and Potential Scenarios
The convergence of technical and fundamental factors creates critical juncture conditions. Institutional confidence and ETF inflows provide some market floor support. However, immediate breakdown risks below $107K remain elevated. Market participants prepare for multiple potential outcomes. A stabilization near 200-day SMA could present accumulation opportunities. Alternatively, breakdown scenarios might test lower support zones. The absence of clear catalysts makes prediction challenging currently.
Frequently Asked Questions
What are the most critical Bitcoin bearish signals to watch?
The RSI below 50, MACD bearish crossover, and price below $107K support represent key indicators. Additionally, monitor the 200-day SMA around $101K for potential breakdown scenarios.
How do ETF outflows impact Bitcoin’s price action?
Substantial ETF outflows indicate institutional selling pressure and reduced demand. The $2 billion outflow in August 2025 significantly contributes to current bearish momentum.
What support levels are most important for Bitcoin?
The $107K–$108K range provides immediate support, while the 200-day SMA near $101K offers stronger technical support. Breakdown below these levels could trigger further declines.
How does Federal Reserve policy affect Bitcoin prices?
Bitcoin historically shows -0.65 inverse correlation to Fed rate changes. Policy ambiguity and mixed messaging create uncertainty that typically pressures cryptocurrency prices.
What role do geopolitical events play in Bitcoin’s performance?
Country-specific shocks can increase crypto exchange premiums, while global geopolitical acts typically decrease premiums and increase risk aversion among investors.
Are there potential buying opportunities despite bearish signals?
Yes, strategic entry points may emerge near the 200-day SMA around $101K if Bitcoin stabilizes at these levels, though caution remains advised given current market conditions.