Bitcoin Cash investors face a decisive moment as BCH breaches its ascending channel, creating a pivotal technical inflection point that could determine the cryptocurrency’s trajectory for weeks to come. This Bitcoin Cash channel breakdown represents one of the most significant technical developments since March 2025, forcing traders to reassess their positions amid evolving market conditions.
Understanding the Bitcoin Cash Channel Breakdown
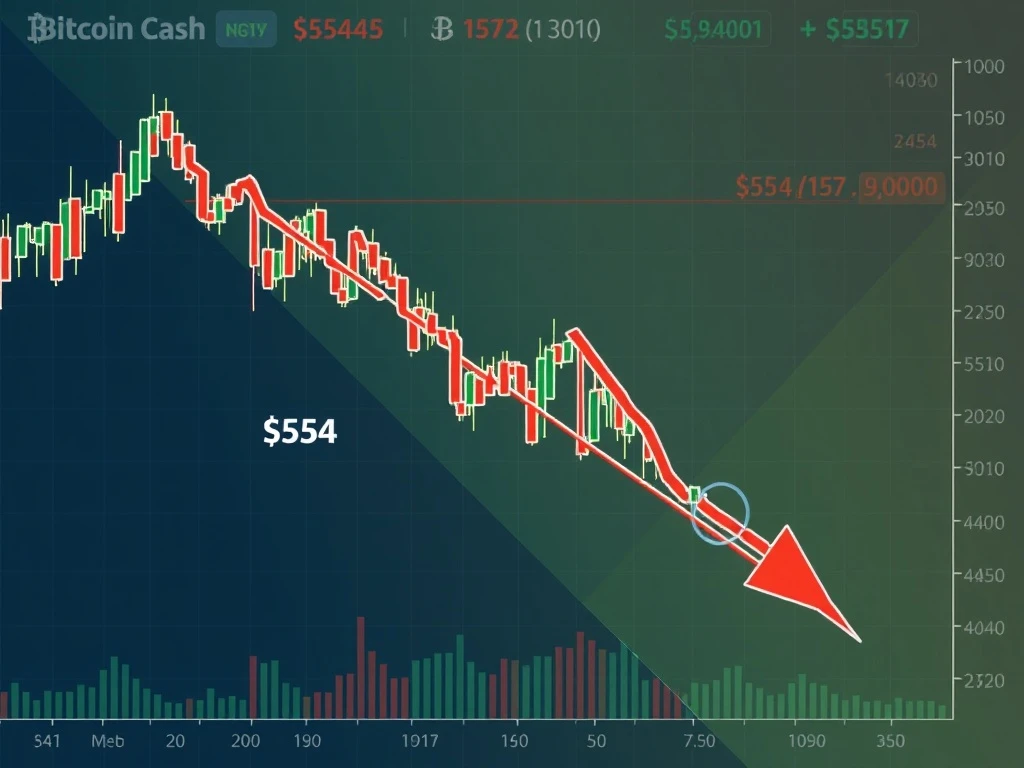
The recent Bitcoin Cash channel breakdown marks a substantial shift in market structure. Technical analysts observe that BCH dropped below its established ascending pattern in late August 2025, triggering immediate bearish sentiment across trading communities. This breakdown suggests potential momentum loss despite previous bullish patterns. Consequently, traders now monitor key levels for confirmation of either recovery or further decline.
Critical Support Levels and Price Targets
The $554 EMA/SMA cluster emerges as the primary battleground following this Bitcoin Cash channel breakdown. This level historically provided substantial support, making its current test particularly significant. Should buyers defend this zone, a rebound toward $600 becomes plausible. However, failure to hold $554 might accelerate declines toward $480 or even $450 support levels. Volume confirmation remains essential for validating either scenario.
Technical Indicators and Market Signals
Multiple indicators provide mixed signals after the Bitcoin Cash channel breakdown. The MACD histogram turned negative, suggesting weakening momentum. Meanwhile, the RSI maintains neutral positioning, offering no clear directional bias. Interestingly, the Chaikin Money Flow shows modest bullish divergence, indicating some underlying buying pressure despite the apparent breakdown. These conflicting signals create uncertainty among market participants.
Tether USDT Phase-Out Impact
The scheduled September 2025 phase-out of Tether USDT from BCH’s SLP token standard adds complexity to the Bitcoin Cash channel breakdown analysis. This development threatens to reduce liquidity within BCH-based DeFi ecosystems, potentially exacerbating selling pressure. Traders must consider how reduced liquidity might amplify price movements in either direction following the technical breakdown.
Trading Strategies and Risk Management
Conservative traders should await confirmation above the 20-day SMA at $572 before considering long positions. Aggressive traders might establish small positions near $530 with tight stop-loss orders. Historical data shows that buying at the $554 support level yielded average returns of +5.22% over 30 days, though with limited statistical significance. Proper position sizing remains crucial given current volatility.
Market Outlook and Future Projections
The Bitcoin Cash channel breakdown creates two distinct potential outcomes. A successful defense of $554 could invalidate bearish predictions and initiate a rally toward $600-$800. Alternatively, breakdown confirmation might trigger extended consolidation between $450-$550. Volume analysis becomes critical, as moves above $40 million daily volume would validate bullish scenarios while low volume suggests continued uncertainty.
Frequently Asked Questions (FAQs)
What caused the Bitcoin Cash channel breakdown?
The breakdown resulted from failing to maintain momentum above key resistance levels, combined with broader market pressures and specific concerns about USDT phase-out impacts.
How significant is the $554 support level?
The $554 level represents a crucial technical and psychological barrier that historically provided substantial support during previous market cycles.
Should investors buy after the channel breakdown?
Investment decisions should consider risk tolerance and time horizon. Conservative investors might wait for confirmation above $572, while aggressive traders could consider small positions with strict risk management.
How does USDT phase-out affect BCH price?
The phase-out reduces liquidity in BCH-based DeFi applications, potentially increasing volatility and selling pressure during transition periods.
What time frame should traders monitor?
Traders should watch 4-hour and daily charts for confirmation signals, particularly focusing on volume patterns and indicator crossovers.
Are there bullish factors despite the breakdown?
Yes, including bullish CMF divergence and historical support at current levels, though these must be weighed against negative technical signals.