Bitcoin stands at a critical crossroads in late 2025, caught between conflicting signals that create a fascinating market divergence. Technical indicators flash bearish warnings while institutional money flows in at unprecedented rates, presenting both risks and opportunities for astute investors navigating this complex landscape.
Understanding Bitcoin’s Technical Bearish Signals
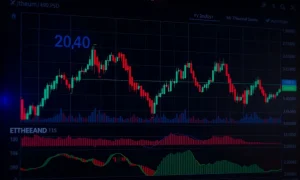
Technical analysis reveals concerning patterns for Bitcoin’s near-term trajectory. The Relative Strength Index (RSI) has declined to 38.62, approaching oversold territory while showing bearish divergence as prices consolidate near $108,000. Meanwhile, the Moving Average Convergence Divergence (MACD) indicator has entered a bearish crossover pattern, with Bitcoin trading below both its 50-day and 100-day exponential moving averages.
Key support levels at $110,750 and $106,500 face significant pressure. A breakdown below $114,000 could trigger deeper corrections toward the $95,000-$100,000 range. The Market Value to Realized Value (MVRV) ratio, a crucial on-chain metric, has dropped below its 365-day simple moving average, historically signaling extended correction periods.
Institutional Bullishness Counteracts Technical Weakness
Despite technical concerns, institutional confidence reaches unprecedented levels. U.S. spot Bitcoin ETFs, particularly BlackRock’s IBIT, have attracted over $132.5 billion in assets under management by Q2 2025. These massive inflows have substantially reduced Bitcoin’s volatility from 4.2% to 1.8%, normalizing Bitcoin as a core portfolio asset for institutional investors.
Corporate treasury allocations continue growing dramatically, with public companies now holding 1.07 million BTC representing 5.4% of total supply. MicroStrategy maintains its massive $73.96 billion Bitcoin position, demonstrating corporate confidence in Bitcoin’s long-term value proposition as a treasury reserve asset.
Regulatory Developments Strengthen Bitcoin’s Foundation
Regulatory clarity has emerged as a significant bullish factor. The U.S. BITCOIN Act of 2025 and the Strategic Bitcoin Reserve’s mandate to purchase 1 million BTC have fundamentally transformed Bitcoin’s legal standing. These developments provide institutional investors with the regulatory certainty required for large-scale allocations.
The SEC’s approval of in-kind redemptions has further lowered operational costs, encouraging broader institutional participation. This regulatory framework has positioned Bitcoin as a legitimate reserve asset within traditional financial systems, creating structural support that didn’t exist in previous market cycles.
The 2025 Halving Impact on Supply Dynamics
Bitcoin’s 2025 halving event reduces block rewards by 50%, creating a dramatic supply-demand imbalance estimated at 40:1. This supply shock occurs while 70% of Bitcoin’s circulating supply remains held by long-term holders who demonstrate minimal selling pressure. Historical analysis of previous halving cycles shows consistent patterns of significant price appreciation following these events.
The 2020 halving drove a 541% price increase over the subsequent 12 months, while previous cycles showed similar explosive growth patterns. This historical precedent, combined with current institutional demand, creates a compelling case for long-term price appreciation despite short-term technical weakness.
Contrarian Investment Opportunities Emerge
The current Bitcoin divergence presents unique opportunities for disciplined investors. The $114,000 level represents a critical technical threshold where a weekly close above this price could reignite bullish momentum. Conversely, a breakdown might trigger deeper corrections but historical rebounds during similar sentiment extremes suggest resilience above $105,000.
Historical analysis of Bitcoin’s MACD “Death Cross” events from 2022 to 2025 reveals instructive patterns. Over 52 qualifying events, the average return 30 trading days post-event was -4.2% with a 63% hit rate for positive outcomes. However, 37% of events led to rebounds within 30 days with average gains of +7.8%.
Strategic Positioning for Long-Term Growth
Investors should consider several strategic approaches to navigate this divergence. Dollar-cost averaging during technical weakness allows accumulation at potentially discounted prices. Monitoring the 30-day MVRV rate, currently at -3.37%, provides insight into potential undervaluation periods that historically preceded sharp rebounds.
Institutional flow patterns continue indicating strong underlying demand despite technical indicators. The U.S. Strategic Bitcoin Reserve’s $120 billion in institutional demand reinforces Bitcoin’s role in macroeconomic hedging strategies. This institutional participation creates a structural floor that differs fundamentally from previous market cycles.
Risk Management Considerations
While the long-term outlook appears bullish, prudent risk management remains essential. The maximum drawdown observed during bearish MACD crossover periods reached -12.8%, underscoring the importance of position sizing and risk tolerance alignment. Investors should prepare for potential volatility while maintaining perspective on long-term fundamentals.
Technical support levels at $105,000 and $100,000 provide important reference points for risk management strategies. A break below these levels might indicate deeper correction potential, though historical patterns suggest strong buying interest emerges at these valuation levels.
Future Outlook and Market Implications
The Bitcoin divergence between technical indicators and institutional fundamentals reflects a market in transition. The combination of the 2025 halving, sustained ETF-driven demand, and regulatory clarity creates conditions potentially conducive to new all-time highs. However, investors must navigate short-term volatility while maintaining focus on long-term value propositions.
Market participants should monitor several key metrics including ETF flow data, on-chain holder behavior, and regulatory developments. These factors will likely determine whether technical weakness prevails or institutional bullishness drives the next major price advance.
Frequently Asked Questions
What technical indicators suggest Bitcoin might correct to $95K-$100K?
The RSI showing bearish divergence at 38.62, MACD bearish crossover, price below 50-day and 100-day EMAs, and MVRV ratio below its 365-day SMA all indicate potential correction risks toward the $95,000-$100,000 range.
How significant are institutional Bitcoin investments in 2025?
Institutional investments have reached unprecedented levels with $132.5 billion in ETF inflows, corporate treasuries holding 1.07 million BTC, and the U.S. Strategic Bitcoin Reserve mandated to purchase 1 million BTC, creating substantial structural demand.
What impact will the 2025 Bitcoin halving have on prices?
The 2025 halving reduces block rewards by 50%, creating a 40:1 supply-demand imbalance while 70% of supply remains held by long-term holders. Historical halving cycles show average 12-month gains exceeding 500% following similar events.
Why is the $114,000 level critical for Bitcoin’s price action?
The $114,000 level represents a key technical threshold where a weekly close above could reignite bullish momentum, while a breakdown might trigger deeper corrections. This level has become a focal point for both technical and institutional traders.
How does the current Bitcoin divergence compare to historical patterns?
The current divergence mirrors historical patterns around halving events where technical weakness often precedes major advances. The 2021 $42,000 fakeout and subsequent recovery provides a relevant precedent for current market conditions.
What risk management strategies should investors consider?
Investors should implement dollar-cost averaging during weakness, monitor key support levels at $105,000 and $100,000, maintain appropriate position sizing for potential 12.8% drawdowns, and focus on long-term fundamentals rather than short-term volatility.