Understanding market sentiment becomes crucial for successful Bitcoin trading. The Bitcoin futures long/short ratio provides traders with invaluable insights into collective market positioning. This powerful indicator reveals whether traders lean bullish or bearish, offering a strategic advantage in volatile cryptocurrency markets.
What Is Bitcoin Futures Long/Short Ratio?
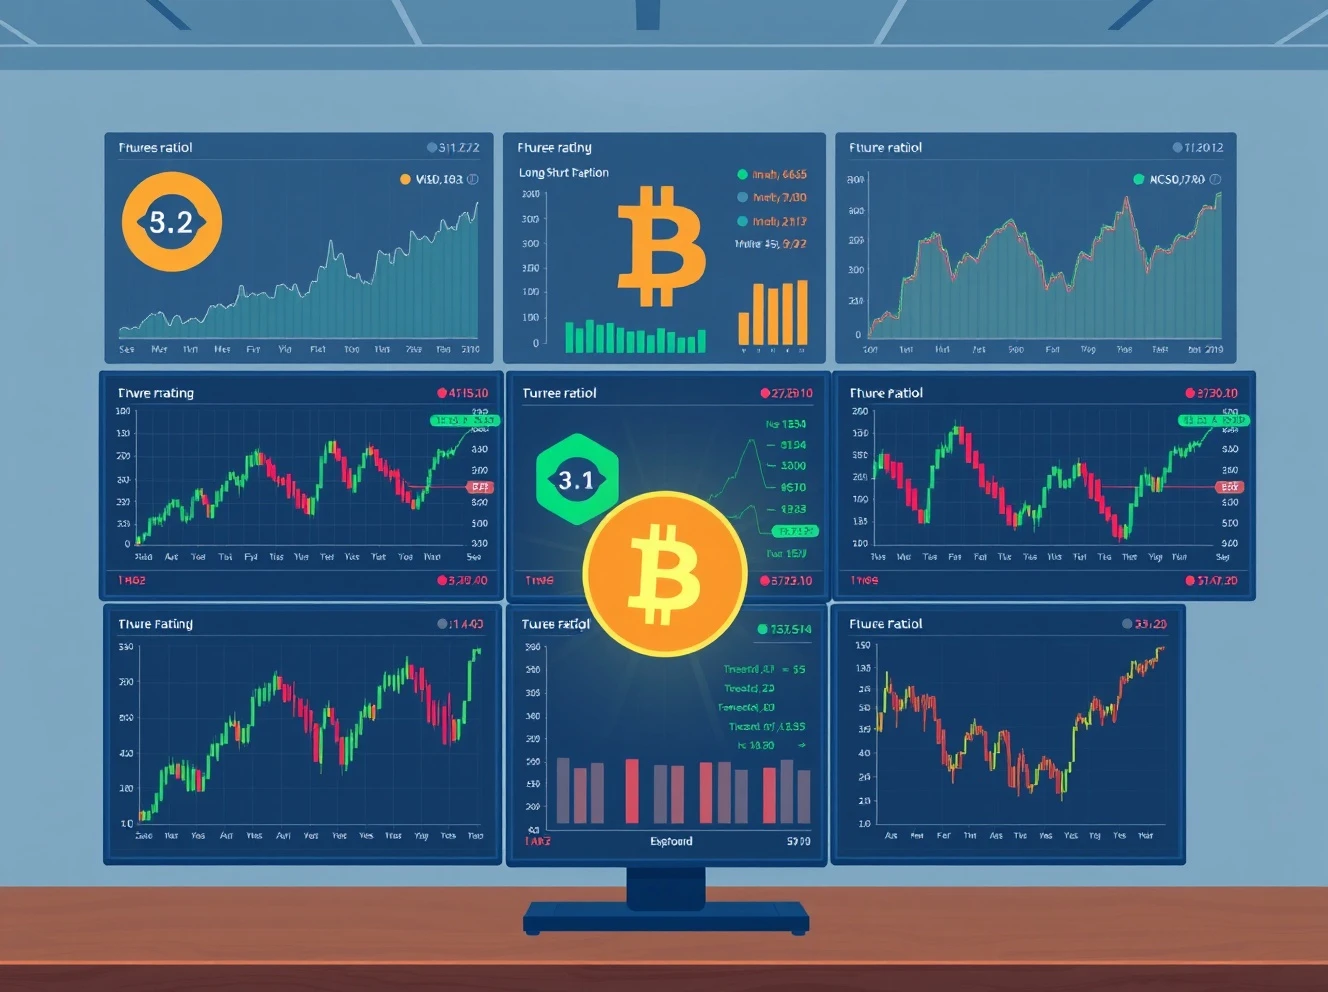
The Bitcoin futures long/short ratio measures the proportion of long versus short positions in perpetual futures markets. This ratio serves as a direct sentiment gauge for cryptocurrency traders worldwide. When the ratio exceeds 1, it indicates bullish dominance among market participants. Conversely, values below 1 suggest bearish sentiment prevails across trading platforms.
Current Market Analysis: Bitcoin Futures Positioning
Recent data reveals fascinating patterns in Bitcoin futures trading sentiment. Across major exchanges, the overall Bitcoin futures long/short ratio shows subtle bearish tendencies. Specifically, the collective market stance demonstrates 49.51% long positions against 50.49% short positions. This slight majority indicates cautious trader expectations regarding Bitcoin’s short-term price movement.
Exchange-Specific Bitcoin Futures Sentiment
Different platforms exhibit varying Bitcoin futures long/short ratio patterns due to diverse trader demographics. Binance shows 47.84% long versus 52.16% short positions, indicating clear bearish preference. Bybit mirrors this sentiment with 48.17% long and 51.83% short positions. However, Gate.io presents contrasting data with 51.62% long against 48.38% short positions, suggesting mild bullish sentiment.
Strategic Trading Applications
Monitoring the Bitcoin futures long/short ratio offers significant advantages for risk management. Extreme ratio values often signal potential market reversals or consolidation periods. Traders should consider these key applications:
- Risk assessment through sentiment analysis
- Position timing based on crowd psychology
- Market reversal identification through extreme ratios
Practical Implementation Guidelines
Effective use of the Bitcoin futures long/short ratio requires contextual understanding and complementary analysis. Traders should combine this indicator with technical analysis tools and fundamental market factors. Regular monitoring of ratio changes helps identify shifting sentiment patterns before major price movements occur.
Conclusion: Leveraging Market Sentiment
The Bitcoin futures long/short ratio remains an essential tool for modern cryptocurrency traders. This indicator provides clear insights into market psychology and positioning trends. While not infallible, it significantly enhances trading strategy development when used alongside other analytical methods.
Frequently Asked Questions
How often should I check the Bitcoin futures long/short ratio?
Active traders should monitor the ratio daily, while long-term investors might review it weekly. Significant market events warrant immediate ratio checks for updated sentiment analysis.
Can the ratio predict Bitcoin price movements accurately?
While not a perfect predictor, extreme ratio values often precede significant price movements. However, always use it alongside other indicators for comprehensive analysis.
Why do exchanges show different Bitcoin futures long/short ratios?
Different trader demographics, leverage options, and geographic user bases create varying sentiment patterns across exchanges. This diversity provides valuable comparative data.
How reliable is the Bitcoin futures long/short ratio during high volatility?
The ratio remains reliable but requires careful interpretation during volatile periods. Extreme market conditions might amplify sentiment indicators beyond typical ranges.
Should retail traders follow institutional Bitcoin futures ratios?
Yes, institutional ratios often influence market direction. However, retail traders should also consider their specific risk tolerance and trading timeframe.
What other indicators complement the Bitcoin futures long/short ratio?
Volume analysis, open interest data, and funding rates provide excellent complementary metrics. Technical indicators like RSI and moving averages also enhance ratio interpretation.