Bitcoin HODLers stand at a decisive juncture as 2025 approaches, with the cryptocurrency’s legendary Rainbow Chart projecting both staggering potential gains and sobering corrections. Current market dynamics suggest long-term holders face their most critical investment decisions yet.
Bitcoin Rainbow Chart’s 2025 Projection Range
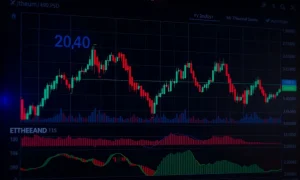
The Bitcoin Rainbow Chart presents a dramatic price spectrum for September 2025, spanning from $36,596 to $409,412. This logarithmic regression model utilizes historical data to create seven distinct color-coded bands representing various market sentiment phases. Currently trading near $108,400, Bitcoin positions itself at the lower boundary of the “HODL!” band, typically considered a fair-value zone for long-term holders.
Understanding the Rainbow Band System
The chart’s color-coded system provides clear visual guidance for Bitcoin HODLers. The lowest “Basically a Fire Sale” band indicates extreme undervaluation between $36,596-$47,905. Progressively higher bands include:
• BUY! zone: $47,905-$64,791
• Accumulate range: $64,791-$87,633
• Still Cheap band: $87,633-$108,379
• Maximum Bubble Territory: $303,932-$409,412
Critical Limitations for Bitcoin HODLers
Despite its popularity, the Rainbow Chart possesses significant constraints that Bitcoin HODLers must acknowledge. The tool relies exclusively on historical data without accounting for real-time macroeconomic shifts, regulatory changes, or unexpected market shocks. Furthermore, subjective band definitions can lead to varying interpretations among different analysts and platforms.
Institutional Adoption Driving 2025 Forecasts
Bitcoin HODLers benefit from growing institutional participation that could validate optimistic projections. Recent developments include Bitcoin ETF approvals and 401(k) plan inclusions, potentially channeling trillions in new liquidity into cryptocurrency markets. These institutional movements typically reduce circulating supply while increasing sustained demand.
2024 Halving Event Impact
The April 2024 halving event historically serves as a major catalyst for Bitcoin price appreciation. Previous cycles indicate that substantial price peaks generally occur 12-18 months post-halving, aligning perfectly with late 2025 projections. This timing suggests Bitcoin HODLers might experience the market cycle’s peak within the forecast window.
Complementary Analysis Strategies
Prudent Bitcoin HODLers should combine Rainbow Chart insights with additional analytical tools. Effective supplementation includes:
• On-chain metrics and exchange flow data
• Technical indicators like RSI and moving averages
• Regulatory development monitoring
• Macroeconomic trend analysis
Broader Market Predictions
Beyond the Rainbow Chart, analyst consensus suggests Bitcoin HODLers could see prices between $145,000 and $1,000,000 by 2025-2030. These projections incorporate factors like corporate treasury adoption, inflation hedging demand, and global monetary policy shifts. However, predictions vary widely based on methodology and underlying assumptions.
Risk Management Considerations
Bitcoin HODLers must implement robust risk management strategies given the projected volatility range. The $409,412 upper projection represents nearly 300% gains from current levels, while the $36,596 lower bound indicates potential 66% declines. This divergence underscores the importance of position sizing and portfolio diversification.
FAQs: Bitcoin HODLers’ 2025 Crossroads
What makes 2025 particularly critical for Bitcoin HODLers?
2025 represents the projected peak period following the 2024 halving event, combining historical cycle patterns with unprecedented institutional adoption that could create optimal market conditions.
How reliable is the Bitcoin Rainbow Chart for investment decisions?
The chart provides valuable historical context but should never serve as a standalone investment tool. Its reliability improves when combined with other analytical methods and real-time market data.
What are the biggest risks Bitcoin HODLers face by 2025?
Major risks include regulatory crackdowns, macroeconomic crises, technological vulnerabilities, and unexpected market shocks that historical models cannot predict.
How does institutional adoption affect long-term Bitcoin HODLers?
Institutional participation typically increases price stability, reduces volatility, and creates sustained demand, potentially benefiting long-term holders through improved market maturity.
Should Bitcoin HODLers adjust strategies based on Rainbow Chart signals?
While the chart offers useful guidance, investment decisions should incorporate personal risk tolerance, financial goals, and comprehensive market analysis rather than single-tool signals.
What time horizon should Bitcoin HODLers consider for the 2025 projections?
The Rainbow Chart projections specifically target September 2025, but investors should maintain flexibility as market conditions evolve and new information emerges throughout the year.