Traders witnessed significant Bitcoin price action on September 6, 2025, as BTC/USDT displayed compelling technical patterns that captured market attention. The trading session revealed crucial insights for cryptocurrency investors seeking profitable opportunities in volatile market conditions.
Bitcoin Price Analysis Reveals Key Technical Patterns
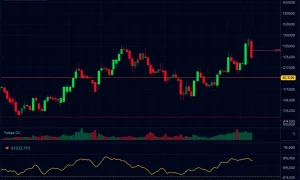
BTC/USDT opened at $110,894.00 and experienced tight range-bound trading between $110,600 and $111,200. Market participants observed a notable bullish engulfing pattern formation around $110,700, suggesting potential trend reversal. This Bitcoin price analysis indicates strong support at $110,600 held multiple times during the session.
Technical Indicators Show Mixed Momentum Signals
Momentum indicators presented a complex picture for traders. The MACD remained in negative territory while showing narrowing bearish momentum. Meanwhile, the RSI oscillated between 45 and 55, indicating neutral market conditions. This Bitcoin price analysis highlights the importance of watching for confirmation signals before entering positions.
Volume and Turnover Analysis Provides Clarity
Total volume reached approximately 13,073.01 BTC with a notional turnover of $1.44 billion. Volume patterns remained moderate throughout the session, aligning closely with price movements. Higher volumes accompanied the late rally from $110,600 to $111,200, confirming genuine buyer interest according to this Bitcoin price analysis.
Fibonacci Levels and Moving Averages Convergence
The 61.8% Fibonacci retracement level at $111,050 coincided with significant moving average resistance. The 200-period moving average at $110,800 provided strong psychological support, creating a convergence zone that attracted trader attention. This Bitcoin price analysis identifies these levels as critical for future price direction.
Trading Strategy Based on Technical Evidence
A potential trading strategy involves entering long positions following bullish engulfing pattern confirmation near key support levels. Stop-loss orders should placement below recent swing lows, while profit targets could focus on the 61.8% Fibonacci level. This Bitcoin price analysis recommends waiting for MACD crossover above the signal line and RSI rising above 50 for additional confirmation.
Market Sentiment and Future Outlook
Traders exhibited cautious bearish sentiment despite the emerging bullish patterns. Resistance at $110,900 faced repeated rejections, indicating lingering selling pressure. This Bitcoin price analysis suggests watching for breakout above $111,200 or breakdown below $110,600 for clearer directional signals.
Frequently Asked Questions
What does the bullish engulfing pattern indicate in Bitcoin trading?
The bullish engulfing pattern suggests potential trend reversal when it forms near support levels. It indicates buyers have overwhelmed sellers during that specific candle period.
How important is the $110,600 support level?
The $110,600 level proved crucial as it held multiple tests during the session. Breaking below this support could trigger further downward movement.
What confirmation signals should traders watch for?
Traders should monitor MACD crossover above the signal line and RSI moving above 50 for additional confirmation of bullish momentum.
How does volume affect Bitcoin price analysis validity?
Higher volume during price movements confirms genuine market participation. Low volume moves may represent false breakouts or lack of conviction.
What timeframes are most relevant for this analysis?
This analysis incorporates both 15-minute and daily chart perspectives, providing comprehensive insights across multiple timeframes.
How should traders manage risk with this setup?
Risk management should include stop-loss orders below recent swing lows and position sizing that limits exposure to 1-2% of trading capital per trade.