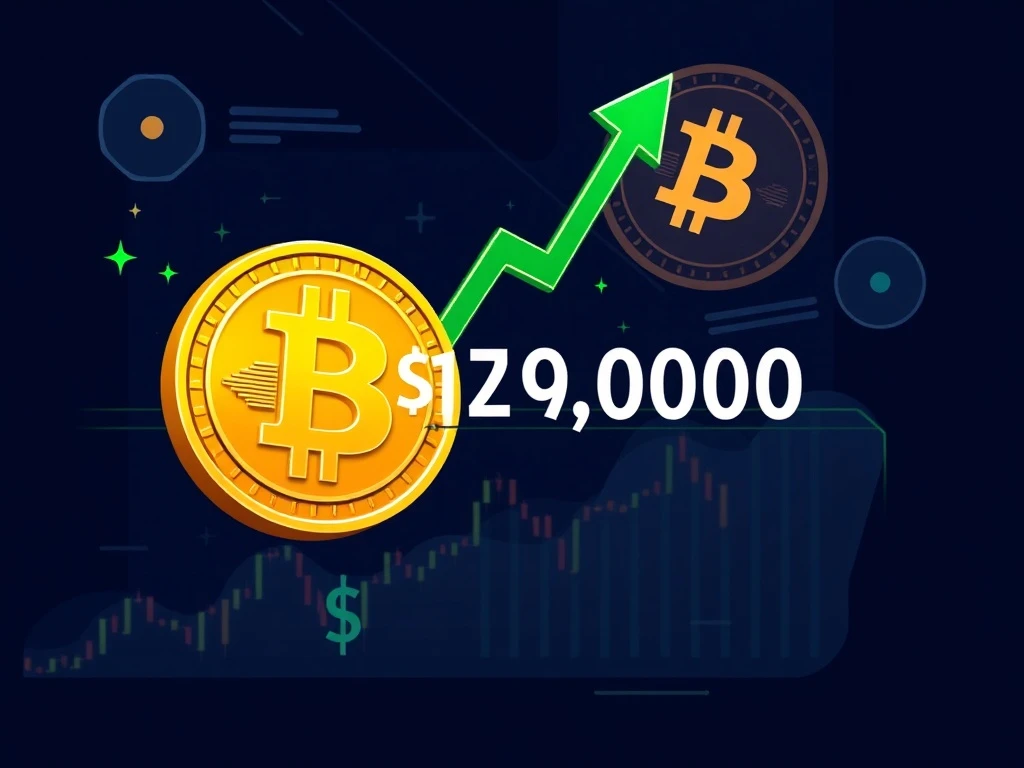
Bitcoin investors breathed a sigh of relief as the cryptocurrency found solid support at $114,755, marking what appears to be the definitive bottom of the recent correction. Four critical market indicators now strongly suggest an imminent Bitcoin price reversal toward the $120,000 threshold.
Bitcoin Options Skew Reveals Extreme Fear Creating Buying Opportunity
The Bitcoin options skew metric surged to its highest level in four months, indicating excessive fear among traders. This crucial indicator typically fluctuates between -6% and +6% during balanced market conditions. However, heightened demand for protective put options pushed it significantly above the neutral band. Historically, such extreme fear levels have created exceptional buying opportunities. For instance, a similar skew jump on August 5 preceded a $9,657 rally within just six days. Likewise, the April 9 skew reading of 13% triggered an $11,474 recovery within four days.
Spot Bitcoin ETF Flows Demonstrate Market Resilience
Despite concerns about potential outflows, spot Bitcoin ETFs show remarkable stability. The $152 billion market comfortably absorbed $1.45 billion in net outflows between July 31 and August 5, resulting in only a modest 6% correction. Market liquidity remains robust, with Bitcoin not experiencing more than a 12% move within 72 hours since April 7. This stability suggests the current Bitcoin price movement represents healthy market consolidation rather than fundamental weakness.
Top Trader Positioning Supports Bitcoin Price Recovery Thesis
Professional traders at major exchanges like OKX and Binance maintained their long positions despite the recent Bitcoin price drop. Data covering spot, margin, and futures markets reveal that top traders reduced longs only marginally between Thursday and Friday, with the long-to-short ratio stabilizing quickly. This positioning indicates either cautious optimism or strategic waiting for potential retests of the $112,000 level before deploying additional capital.
Stablecoin Demand Indicates Controlled Market Sentiment
Tether’s trading activity in China provides additional insight into market sentiment. Currently trading at a 0.8% discount against the official US dollar rate, the stablecoin shows mild pressure to exit crypto markets. However, this discount has remained steady since Friday evening, indicating no worsening sentiment. Typically, strong retail-driven activity pushes stablecoins to a 2% premium, while discounts above 0.5% reflect fear-driven exits.
Conclusion: Bitcoin Price Primed for Significant Rebound
The convergence of these four indicators—options skew, ETF flows, top trader positioning, and stablecoin demand—strongly suggests Bitcoin’s pullback has reached its conclusion. The $114,755 level appears to represent the bottom of this correction, setting the stage for a powerful rebound toward $120,000. Market structure remains intact, and underlying fundamentals continue to support higher Bitcoin price levels in the near term.
Frequently Asked Questions
What is the Bitcoin options skew indicator?
The Bitcoin options skew measures the difference in demand between put and call options. It indicates market sentiment, with high positive values showing fear and negative values indicating greed.
How do spot Bitcoin ETF flows affect price?
Spot Bitcoin ETF flows significantly impact price through direct buying and selling pressure. Large inflows typically drive prices higher, while sustained outflows can create downward pressure.
Why is top trader positioning important?
Top traders often have better market insight and larger capital bases. Their positioning can indicate professional sentiment and potential market direction.
What does stablecoin demand reveal about market sentiment?
Stablecoin trading premiums or discounts reflect retail investor sentiment. Premiums indicate buying interest, while discounts suggest selling pressure or fear.
How reliable are these indicators for predicting bottoms?
While no indicator guarantees exact bottoms, convergence of multiple metrics increases confidence in identifying potential reversal points.
What time frame should investors consider for this analysis?
This analysis focuses on short to medium-term trends, typically relevant for days to weeks rather than long-term investment horizons.