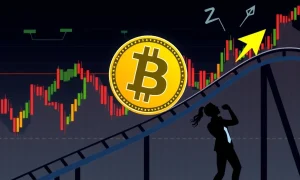
Cryptocurrency traders constantly seek reliable indicators to navigate Bitcoin’s volatile markets. The BTC perpetual futures long/short ratio has emerged as a crucial contrarian tool that reveals market sentiment extremes and predicts potential reversals. This powerful metric analyzes trader positioning across major exchanges to identify overbought or oversold conditions.
Understanding BTC Perpetual Futures Ratios
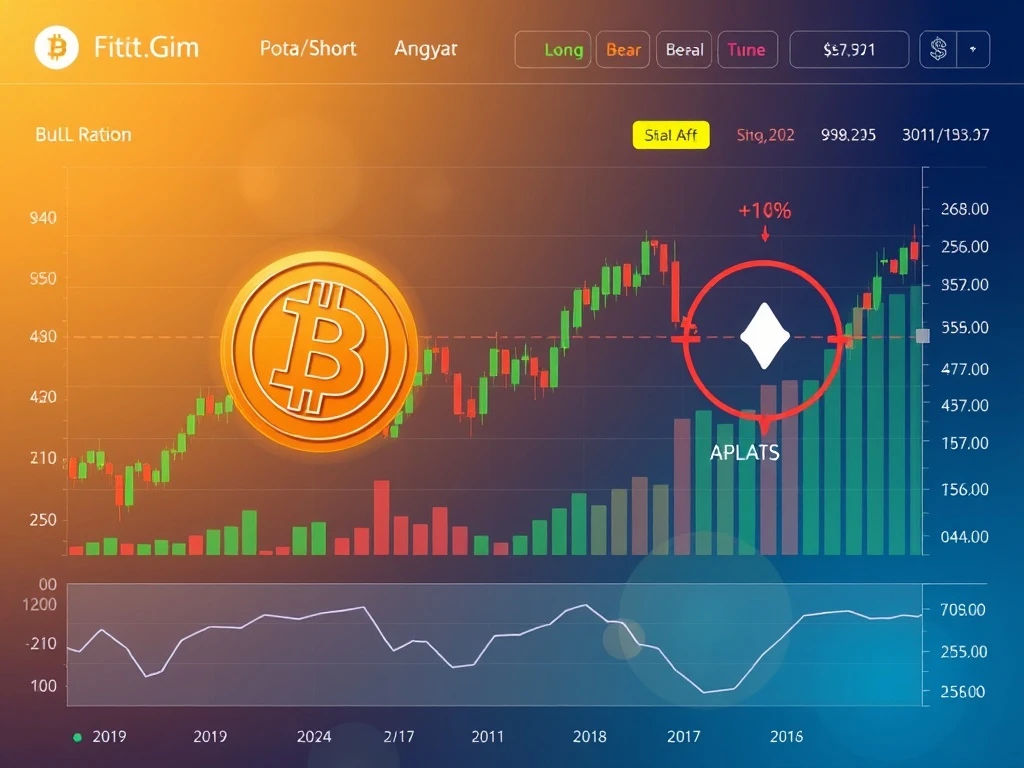
BTC perpetual futures contracts allow traders to speculate on Bitcoin’s price direction without expiration dates. The long/short ratio measures the percentage of traders holding bullish versus bearish positions across exchanges like Binance, Bybit, and Gate.io. Recent data shows a marginal bearish bias with 50.66% short positions versus 49.34% long positions globally. This ratio serves as a sentiment gauge, indicating whether the market leans toward optimism or pessimism.
Historical Performance of BTC Perpetual Futures
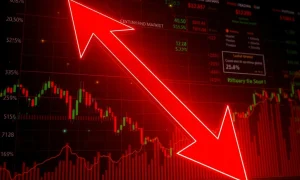
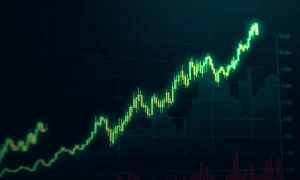
Historical extremes in BTC perpetual futures ratios have consistently predicted major market movements. In Q1 2025, the ratio reached an extreme bullish level of 6.03, signaling overbought conditions that preceded a 20% price correction. Conversely, a ratio of 0.44 in July 2023 marked bearish extremes and triggered a 20% price rebound. These patterns demonstrate how crowd psychology often reaches peaks before market reversals occur.
Current Market Analysis
The current BTC perpetual futures landscape shows cautious positioning rather than extreme sentiment. August 2025 data reveals near-equilibrium conditions with 49.47% long positions and 50.53% short positions globally. Exchange-specific variations exist, with Bybit showing 52.29% short bias while Gate.io maintains 51.03% long positions. This diversity highlights the importance of cross-exchange analysis for accurate market assessment.
Effective Trading Strategies
Successful traders combine BTC perpetual futures ratios with complementary indicators. Funding rates provide additional context about market leverage and potential liquidation events. On-chain metrics offer fundamental insights into network activity and investor behavior. Macroeconomic factors, including ETF flows and regulatory developments, complete the comprehensive analysis framework. This multi-dimensional approach enhances prediction accuracy.
Risk Management Considerations
Traders must recognize that BTC perpetual futures ratios work best as contrarian indicators at extremes. Thresholds around 0.7 for bearish conditions and 4.0 for bullish scenarios have historically signaled turning points. However, minor deviations from equilibrium require additional confirmation from other metrics. Proper position sizing and stop-loss strategies remain essential for managing volatility risks.
Future Market Outlook
The evolving cryptocurrency derivatives market continues to refine BTC perpetual futures analysis. As trading volumes grow and more institutional participants enter the space, these ratios may become even more significant. Traders should monitor developing patterns and adapt their strategies accordingly while maintaining disciplined risk management practices.
Frequently Asked Questions
What is a BTC perpetual futures long/short ratio?
The ratio measures the percentage of traders holding long versus short positions in Bitcoin perpetual futures contracts across major exchanges, serving as a market sentiment indicator.
How often should traders check these ratios?
Professional traders typically monitor ratios daily while paying special attention to extreme readings that historically precede market reversals.
Which exchanges provide the most reliable data?
Major exchanges like Binance, Bybit, and Gate.io offer reliable data, but cross-exchange analysis provides the most comprehensive market view.
Can these ratios predict exact price movements?
While ratios indicate potential reversals, they don’t predict exact price targets or timing. They work best as part of a comprehensive trading strategy.
How do funding rates complement ratio analysis?
Funding rates indicate leverage levels and potential liquidation pressures, providing context about whether current sentiment is sustainable.
What constitutes an extreme ratio reading?
Historical data shows ratios below 0.7 or above 4.0 often signal extreme market conditions that typically precede significant price movements.