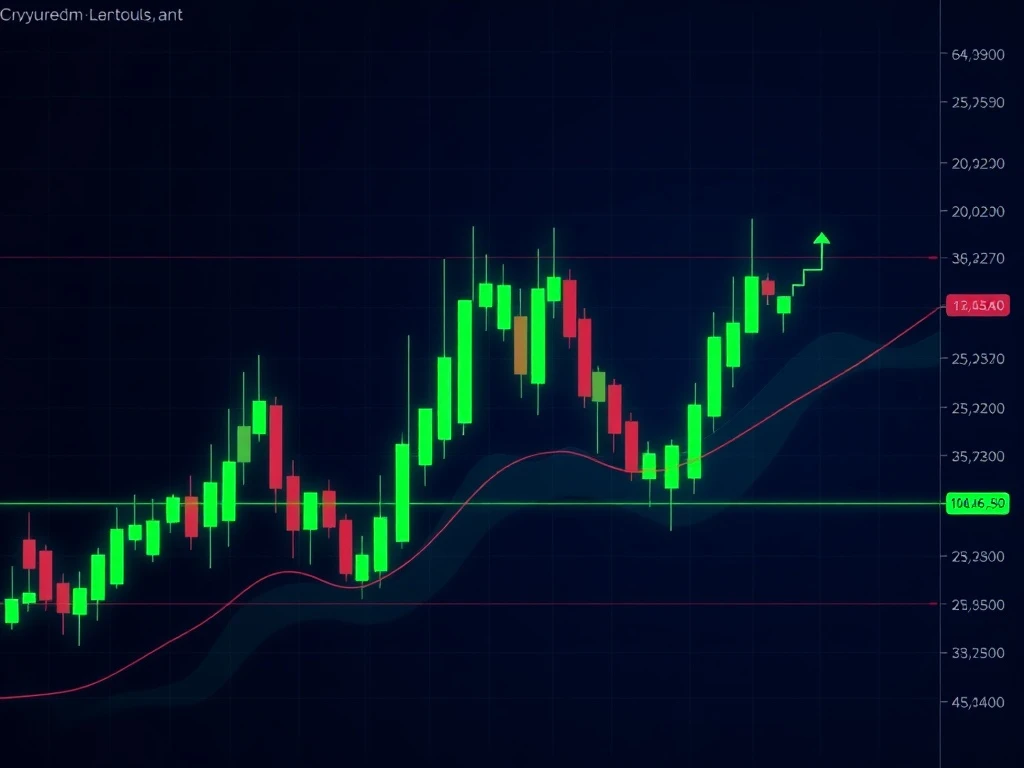
Cryptocurrency traders witnessed a significant BTCDAI surge on September 5, 2025, as the pair gained 1.74% with extraordinary volume expansion. This dramatic movement captured attention across trading platforms, signaling potential continuation of bullish momentum.
BTCDAI Technical Breakout Analysis
The BTCDAI pair demonstrated remarkable strength throughout the trading session. Price action broke above critical resistance levels, including the 61.8% Fibonacci retracement at 111,453.34 DAI. This breakthrough occurred alongside a 220% volume increase, confirming genuine buyer interest.
Key Technical Indicators for BTCDAI
Several technical indicators supported the BTCDAI bullish thesis. The MACD displayed a clear bullish crossover during morning hours. Meanwhile, the RSI reached 68 at peak levels, indicating strong momentum without extreme overbought conditions. The 20-period moving average provided dynamic support throughout the session.
Volume and Momentum Confirmation
Volume analysis revealed crucial insights into BTCDAI market dynamics. A massive volume spike occurred between 05:30–06:00 ET, coinciding with the strongest price advance. This volume profile showed positive divergence from morning lows, where volume increased despite price retesting support levels.
Bollinger Band Expansion Signals
The BTCDAI price action exhibited classic Bollinger Band behavior. Early session contraction gave way to significant expansion during the breakout phase. Price closed above the upper band, indicating strong trend continuation potential rather than temporary volatility.
Fibonacci Levels and Support Structure
Fibonacci retracement levels provided clear guidance for BTCDAI price action. The 38.2% level at 110,863.56 DAI acted as robust support during pullbacks. The breakthrough above the 61.8% level confirmed bullish sentiment dominance throughout the session.
Trading Strategy Implications
The BTCDAI setup presents compelling trading opportunities. Breakout above key Fibonacci levels combined with moving average support creates a high-probability scenario. Volume confirmation and indicator alignment suggest continued upward momentum potential.
Market Context and Future Outlook
BTCDAI performance reflects broader cryptocurrency market trends. The pair’s ability to maintain position above multiple moving averages on daily charts indicates sustained bullish sentiment. This technical strength suggests potential for further gains.
Frequently Asked Questions
What caused the BTCDAI price surge?
The surge resulted from technical breakout above key resistance levels, accompanied by 220% volume increase and strong indicator alignment.
Is BTCDAI overbought after this rally?
While RSI reached 68, indicating strong momentum, it hasn’t entered extreme overbought territory yet, suggesting room for further advancement.
What are key support levels for BTCDAI?
Critical support exists at the 38.2% Fibonacci level (110,863.56 DAI) and the 20-period moving average, which provided dynamic support throughout the session.
How significant was the volume increase?
The 220% volume surge was exceptionally significant, indicating genuine buyer interest and confirming the breakout’s validity beyond price action alone.
What time showed the strongest buying activity?
The 05:30–06:00 ET window witnessed the most substantial volume spike and price advancement, indicating concentrated accumulation activity.
Does the technical setup suggest continued gains?
Multiple technical factors including Fibonacci breakout, moving average support, and indicator alignment suggest strong potential for continued upward movement.