Ethereum investors are witnessing a remarkable historical pattern repetition that could signal the beginning of a major Ethereum bull run. The cryptocurrency’s current technical setup mirrors its 2019 cycle, which preceded a staggering 2,550% price surge. This parallel suggests we might be standing at the threshold of another significant Ethereum bull run phase.
Technical Indicators Point to Impending Ethereum Bull Run
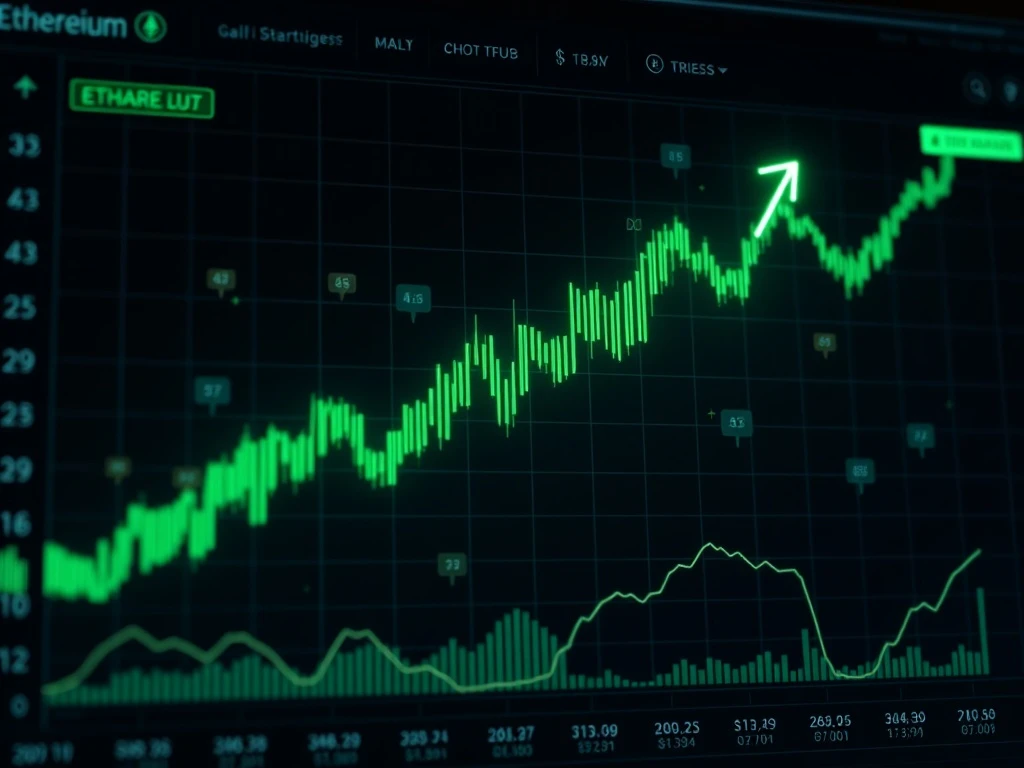
Ethereum’s technical landscape shows compelling similarities to the 2019 cycle that launched its previous major bull run. The 7-day RSI currently sits at 44, indicating a slightly oversold condition similar to neutral readings observed before the 2019 recovery. Meanwhile, moving averages present mixed signals that historically preceded substantial upward movements.
Key technical factors supporting an Ethereum bull run:
- Descending broadening wedge pattern tightening
- High trading volume at $35.73B in 24 hours
- Whale accumulation of 6.84% circulating supply
- Historical 6-month rally pattern repetition
Fundamental Catalysts Driving Ethereum’s Growth
Ethereum’s fundamental strength has dramatically improved since 2019, creating a stronger foundation for the potential bull run. Network upgrades including Pectra and Fusaka have boosted scalability to over 100,000 TPS. The Dencun upgrade significantly reduced Layer 2 costs by 94%, enabling 30 million daily transactions.
Institutional adoption has surged remarkably, with Ethereum ETFs attracting $29.22 billion in net inflows since July 2024. Corporate treasuries now hold 4.10 million ETH valued at $17.66 billion. Additionally, staking yields of 3.8% APY have drawn 6.1 million ETH into staked capital.
Market Sentiment and Prediction Metrics
Prediction markets on Polymarket assign an 88% probability to Ethereum reaching $5,000 by late August 2025. This optimistic outlook stems from several converging factors. Ethereum’s market capitalization of $568 billion now surpasses Mastercard’s $541 billion valuation. This reflects Ethereum’s growing role as the backbone of DeFi and stablecoin ecosystems.
Current on-chain metrics show 29.6% of ETH supply staked, creating deflationary pressure. Exchange-held ETH continues declining, reducing selling pressure. These factors combined with macroeconomic tailwinds and regulatory clarity create ideal conditions for an Ethereum bull run.
Historical Patterns and Future Projections
The 2019 cycle provides a valuable blueprint for understanding current market dynamics. Ethereum broke out of a similar descending wedge pattern to surge from $180 to $700 during its previous bull run. Current technical analysis suggests we might see a comparable percentage gain from current levels.
Market analysts note that Ethereum’s current consolidation between $3,000 and $5,000 mirrors previous accumulation phases. The mixed moving average signals and oversold RSI conditions historically preceded sustained upward movements. These indicators collectively support the $5,000 price target hypothesis.
Risk Factors and Market Considerations
While the Ethereum bull run thesis appears strong, investors should consider several risk factors. Market volatility remains elevated, and regulatory developments could impact price movements. Technical patterns, while historically reliable, don’t guarantee future performance.
Investors should monitor key resistance levels and on-chain whale activity for confirmation signals. The market’s response to Federal Reserve policies and broader macroeconomic conditions will also influence Ethereum’s price trajectory. Diversification and risk management remain crucial in cryptocurrency investing.
Conclusion: Preparing for Potential Growth
Ethereum’s current market position presents a compelling case for potential significant growth. The convergence of technical patterns, fundamental improvements, and institutional adoption creates a favorable environment. While past performance doesn’t guarantee future results, the historical parallels to the 2019 cycle provide valuable insights for market participants.
As Ethereum continues evolving as a blockchain platform, its value proposition strengthens beyond mere speculation. The network’s utility in decentralized finance, NFTs, and various applications supports long-term growth potential. Investors should conduct thorough research and consider their risk tolerance when evaluating Ethereum investment opportunities.
Frequently Asked Questions
What technical indicators suggest an Ethereum bull run is possible?
The descending broadening wedge pattern, oversold RSI conditions, and historical pattern repetition from 2019 all suggest potential upward movement. High trading volume and whale accumulation further support this thesis.
How does current institutional adoption compare to 2019?
Current institutional adoption dramatically exceeds 2019 levels. Ethereum ETFs have attracted $29.22 billion in net inflows since 2024, and corporate treasuries hold 4.10 million ETH compared to minimal institutional interest in 2019.
What price target are prediction markets suggesting?
Prediction markets on Polymarket assign an 88% probability to Ethereum reaching $5,000 by late August 2025. This target is based on technical analysis, fundamental improvements, and market sentiment.
How have network upgrades improved Ethereum’s fundamentals?
The Pectra, Fusaka, and Dencun upgrades have significantly enhanced Ethereum’s scalability and reduced costs. These improvements enable 100,000+ TPS and have reduced Layer 2 costs by 94%, supporting increased adoption and utility.
What risks should investors consider regarding the Ethereum bull run thesis?
Investors should consider market volatility, regulatory developments, and the inherent uncertainty of technical patterns. While historical parallels exist, they don’t guarantee future performance, and proper risk management remains essential.
How does staking impact Ethereum’s price potential?
Staking creates deflationary pressure by locking up supply and reducing selling pressure. With 29.6% of ETH supply staked and yielding 3.8% APY, this mechanism supports price stability and potential appreciation during bull market conditions.