The PORTAL token experienced a dramatic 18.36% single-session collapse on September 6, 2025, triggering alarm bells across cryptocurrency markets. This severe decline represents a critical technical breakdown that demands immediate attention from traders and investors monitoring digital asset movements.
PORTAL Token Technical Breakdown Analysis
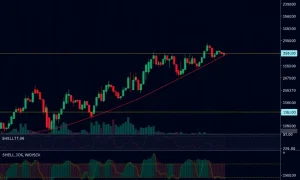
Technical indicators clearly signaled the PORTAL token’s vulnerability before the substantial drop. The 30-day price chart demonstrated consistent weakness with absent bullish momentum. Moreover, the 50-day and 200-day simple moving averages showed concerning divergence patterns. This divergence reinforced medium-term bearish sentiment among market analysts. Consequently, the failure to maintain position above the 200-day SMA emerged as a significant red flag.
RSI Indicators and Oversold Conditions
The Relative Strength Index provided crucial insights into the PORTAL token’s downward trajectory. It dropped below the critical 30 threshold, entering technically oversold territory. However, this oversold condition failed to generate the typical bullish reversal pattern. Instead, it confirmed bearish exhaustion within the market. This divergence between price action and RSI movement indicated diminishing buyer aggression. Therefore, the probability of near-term recovery appears substantially reduced.
Bollinger Band Breakdown Consequences
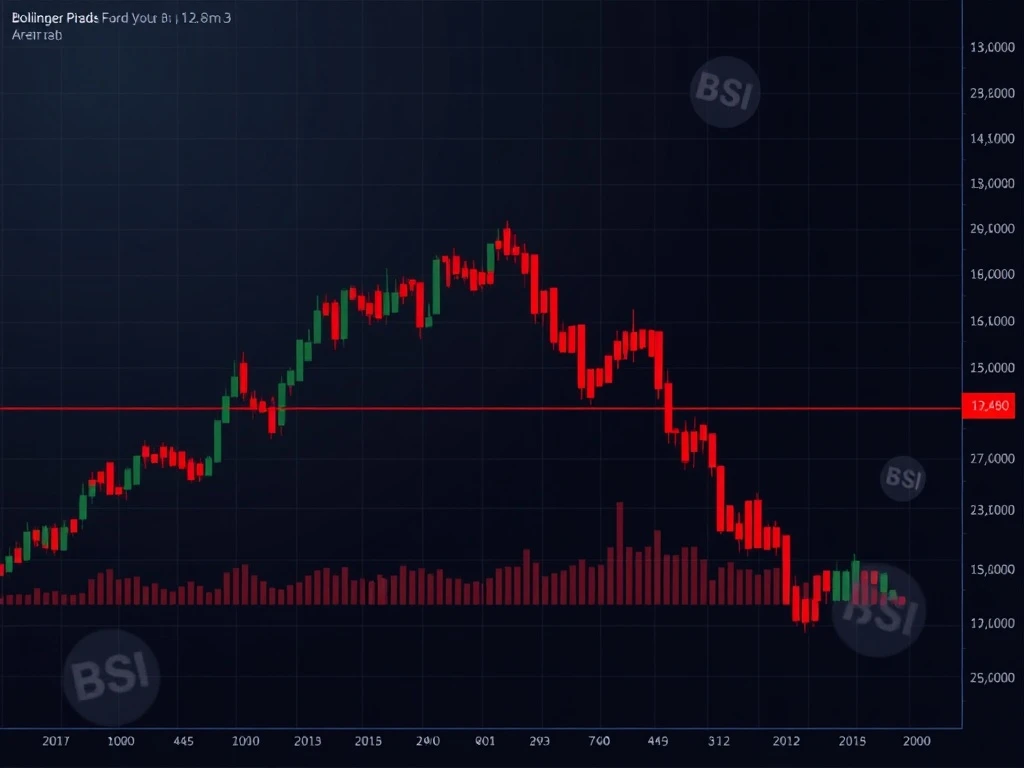
Bollinger Band analysis revealed multiple false tests preceding the final breakdown. The recent breach below the lower band confirmed a fundamental shift in market dynamics. This breakdown triggered increased short positioning among institutional traders. Algorithmic trading systems subsequently adopted bearish strategies in response. Quantitative analysts observed sustained selling pressure from liquidity providers. On-chain metrics supported this technical analysis with wallet distribution shifting toward smaller holders.
Market Impact and Trader Response
Traders responded aggressively to the PORTAL token’s technical breakdown. Short interest increased dramatically following the confirmed breakdown pattern. Risk management systems automatically triggered sell orders across multiple platforms. Liquidity providers accelerated their distribution strategies accordingly. Market makers widened spreads to account for increased volatility. This collective response amplified the downward pressure on token valuation.
Future Outlook for PORTAL Token
The technical outlook remains challenging for the PORTAL token despite oversold conditions. Historical patterns suggest continued pressure until fundamental catalysts emerge. Trading volume must stabilize before considering potential recovery scenarios. Monitoring on-chain activity becomes essential for identifying trend reversals. Market participants should watch for RSI divergence patterns signaling momentum shifts. Additionally, Bollinger Band squeeze formations may indicate volatility compression before significant moves.
Frequently Asked Questions
What caused the PORTAL token’s 18.36% drop?
The decline resulted from technical breakdowns in both RSI indicators and Bollinger Bands, combined with sustained selling pressure from liquidity providers.
Is the PORTAL token currently oversold?
Yes, the RSI dropped below 30, indicating oversold conditions, but the absence of bullish reversal suggests continued weakness.
How are algorithmic traders responding to this movement?
Algorithmic systems have predominantly adopted bearish strategies, increasing short positions and implementing risk management protocols.
What technical levels should traders monitor now?
Traders should watch the 200-day SMA resistance and Bollinger Band boundaries for potential breakout or breakdown signals.
Could this represent a buying opportunity?
While oversold conditions exist, the lack of bullish reversal patterns suggests caution until confirmation of momentum shift occurs.
What on-chain metrics support this technical analysis?
Wallet distribution trends show increased selling from larger holders, while transaction volume patterns confirm sustained distribution pressure.