Solana (SOLUSD) faces a crucial technical juncture as volatility contracts near the $200 psychological support level. Traders watch closely as the cryptocurrency consolidates following a sharp selloff, with key indicators signaling potential breakout directions. This comprehensive technical analysis examines the critical patterns and signals that could determine Solana’s next major move.
Solana Technical Analysis: Current Market Position
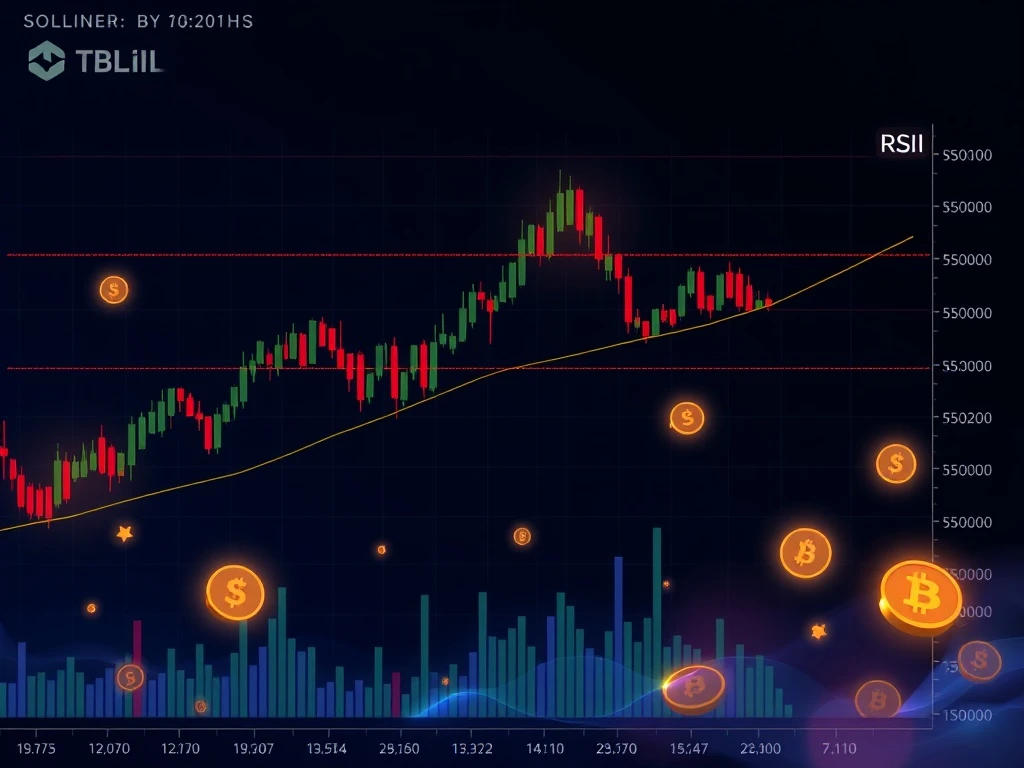
Solana currently trades within a tight range between $198.88 and $206.13, having closed at $203.0 after testing crucial support levels. The 15-minute chart reveals a bearish breakdown pattern followed by failed rebound attempts. Importantly, the $200.38-$200.73 support zone has held multiple tests, indicating potential buyer interest at these levels. However, the failed Morning-Star pattern suggests weakening bullish momentum despite oversold conditions.
Key Technical Indicators and Signals
Several critical indicators provide mixed signals for Solana’s near-term direction. The RSI sits at 29.3, indicating oversold conditions but lacking volume confirmation for a reversal. Meanwhile, the MACD remains below the zero line with a bearish crossover, reinforcing downward pressure. Bollinger Bands show significant contraction, suggesting imminent volatility expansion. Additionally, volume patterns reveal spikes during breakdowns but dryness at lower levels, indicating uncertain market sentiment.
Support and Resistance Levels
Critical technical levels define Solana’s current trading range. The $200.38 level represents the 78.6% Fibonacci retracement and has provided strong support. Conversely, the $202.81 level (61.8% retracement) and $204.0 (50% daily retracement) offer immediate resistance. A break below $200.38 could trigger further selling toward $195, while reclaiming $204.0 might signal short-term recovery potential.
Volume Analysis and Market Participation
Volume patterns reveal interesting market dynamics. Significant spikes occurred during the initial breakdown at $200.38 and during failed rebound attempts near $204.97. However, recent volume diminishment suggests reduced conviction from both buyers and sellers. The relatively low notional turnover of $89,631.66 indicates possible reduced participation from institutional players, often preceding significant market moves.
Risk Management Considerations
Current market conditions warrant careful risk management strategies. The failed Morning-Star pattern historically shows negative returns in similar volatile environments. Traders should consider tight stop-losses below $200 and monitor volume confirmation for any potential reversal signals. The contracting volatility suggests preparing for potential sharp moves in either direction.
Market Outlook and Potential Scenarios
Two primary scenarios emerge from current technical patterns. A break below $200.38 could trigger further selling toward $195-$190 levels. Alternatively, a volume-supported break above $204.0 might initiate a short-term recovery toward $208-$210. The tightening Bollinger Bands suggest an imminent resolution of the current consolidation phase.
Frequently Asked Questions (FAQs)
What does the oversold RSI mean for Solana?
The oversold RSI at 29.3 suggests potential buying opportunity but requires volume confirmation for validity. Without supporting volume, oversold conditions can persist during strong downtrends.
Why did the Morning-Star pattern fail?
The pattern failed due to lack of follow-through buying volume and overall bearish market sentiment. Historical data shows this pattern has poor performance in volatile crypto markets.
What are the key support levels to watch?
The $200.38 level is critical immediate support, followed by psychological support at $200. A break below could target $195-$190 levels.
How reliable are Bollinger Band contractions?
Bollinger Band contractions reliably precede volatility expansions but don’t predict direction. Traders should prepare for moves in either direction when bands tighten this significantly.
What volume confirmation indicates a real reversal?
A valid reversal requires volume increasing by至少 50% above recent averages during upward moves, particularly when breaking above key resistance levels.
How should traders position given current conditions?
Traders should wait for a clear break of either $200 support or $204 resistance with volume confirmation before taking significant positions, using tight risk management.