The TRBBTC trading pair just delivered one of its most dramatic sessions of 2025, surging past critical resistance levels with explosive volume spikes that caught many traders by surprise. This afternoon rally represents a significant shift in market dynamics that demands immediate attention from cryptocurrency investors.
TRBBTC Technical Breakdown and Key Levels
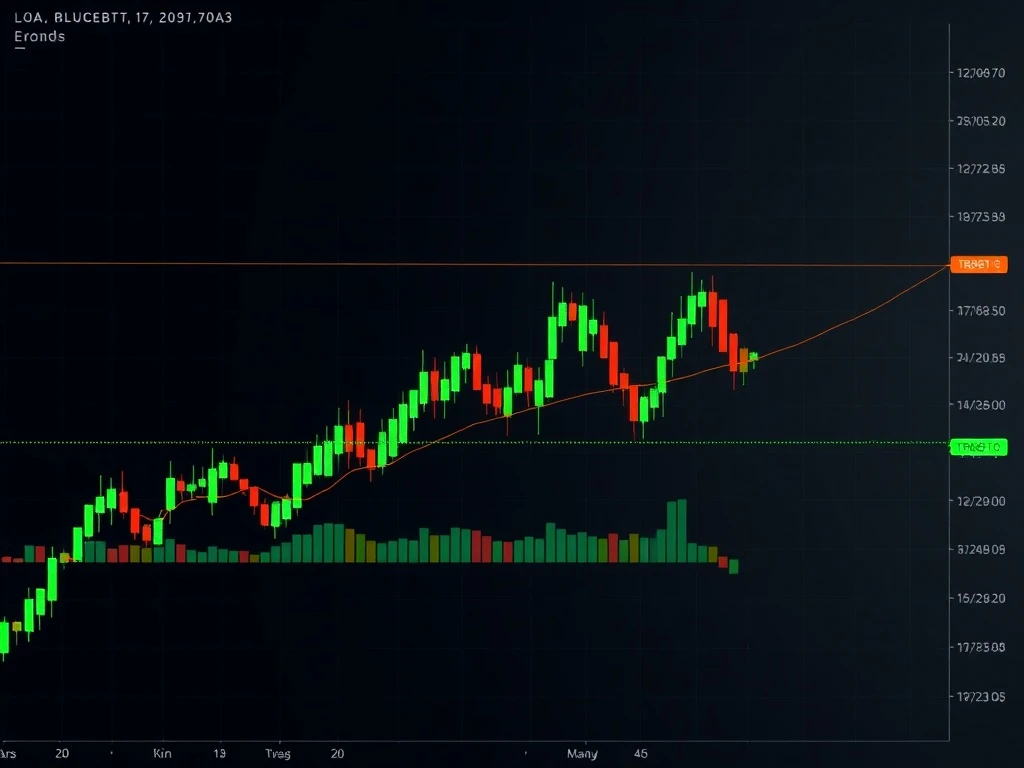
TRBBTC opened at 0.000296 on September 4th, initially trading in a tight consolidation pattern. However, the pair suddenly broke out above 0.000299 with substantial volume confirmation. This movement established crucial support at 0.000297-0.000298 while resistance formed near 0.000303-0.000304. The session high reached 0.000304, representing a significant 3.2% intraday gain that demonstrates strong buying pressure.
Technical Indicators Signal Bullish Momentum
Multiple technical indicators support the TRBBTC bullish thesis. The RSI sits at 52, indicating room for upward movement without overbought conditions. Meanwhile, the MACD crossed above its signal line early in the session and maintained positive territory throughout. Moving averages align bullishly, with price trading above both the 20 and 50-period MAs on shorter timeframes.
Volume Analysis Confirms Breakout Validity
Volume patterns provide critical confirmation for the TRBBTC move. Trading activity remained unusually low during consolidation phases but spiked dramatically at key psychological levels. Specifically, volume surged at both 0.000299 and 0.000304, with notional turnover reaching $2.917 at the higher level. This volume-price alignment suggests genuine market participation rather than artificial pumping.
Bollinger Bands Expansion and Volatility Patterns
TRBBTC volatility expanded significantly during the afternoon rally. Bollinger Bands widened considerably as price broke above the upper band, indicating strong momentum. The pair spent extended periods outside the upper band, particularly after 04:00 ET on September 5th. This expansion suggests continued movement potential, though traders should watch for mean reversion signals.
Fibonacci Retracement Targets and Risk Levels
Applying Fibonacci analysis to the recent swing reveals key levels for TRBBTC. The 61.8% retracement sits at 0.000299, while the 38.2% level rests at 0.000297. Currently, price approaches the 78.6% level at 0.000303, which could act as both target and potential exhaustion point. The daily chart shows the 50% retracement of the broader move near 0.000303, reinforcing its importance.
Risk Management and Forward Outlook
Trading TRBBTC requires careful risk management given current volatility levels. A break above 0.000303 with strong volume could trigger movement toward 0.000306-0.000307. Conversely, rejection at 0.000302 or bearish reversal patterns might prompt a pullback to 0.000297-0.000298 support. Monitor RSI for divergence signals and volume for confirmation of either scenario.
Frequently Asked Questions
What caused the TRBBTC afternoon rally?
The rally was driven by combination of technical breakout above key resistance at 0.000299 and substantial volume increases at psychological price levels.
What are the key support and resistance levels for TRBBTC?
Critical support resides at 0.000297-0.000298, while immediate resistance sits at 0.000303-0.000304. Breach of either level could determine near-term direction.
Is TRBBTC currently overbought?
With RSI at 52, TRBBTC shows no immediate overbought conditions. However, traders should monitor for bearish divergence if price continues advancing rapidly.
What volume patterns confirm the TRBBTC move?
Volume spikes at 0.000299 and 0.000304, accompanied by high notional turnover, provide strong confirmation of genuine market participation rather than weak-handed speculation.
How should traders approach TRBBTC position sizing?
Given expanded volatility, reduce position sizes accordingly and place stop-losses below recent swing lows or key support levels to manage risk effectively.
What timeframes show the clearest TRBBTC signals?
The 15-minute chart reveals clear consolidation and breakout patterns, while daily charts provide context for broader trend direction and significant moving average interactions.