The cryptocurrency market watches intently as XRP’s rare golden cross formation triggers heated debate among traders. This technical pattern, typically considered bullish, emerges amid concerning price action that dropped XRP to $2.80. Market participants now question whether this signals an impending rally or masks deeper bearish tendencies.
Understanding the XRP Golden Cross Phenomenon
The XRP golden cross occurs when the 50-day moving average crosses above the 200-day moving average. Historically, this pattern signaled upward momentum for XRP. However, current market conditions present a contradictory scenario. Despite this technical formation, XRP faces significant selling pressure and declining investor engagement.
Bearish Indicators Challenging the XRP Golden Cross
Several metrics contradict the traditional bullish interpretation of the XRP golden cross. Active addresses dropped dramatically to 19,250 from over 50,000 in July. Open interest declined to $7.7 billion from $10.94 billion. These figures suggest waning trader confidence and reduced market participation.
Technical Patterns and Price Projections
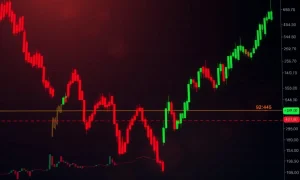
XRP’s daily chart shows a descending triangle pattern with flat support at $2.70. A break below this level could push prices toward $2.08. Conversely, holding above $2.70 might trigger a rally to $3.09. The price currently moves within a parallel channel between $2 and $3.60.
Long-Term XRP Golden Cross Implications
Analysts identify a multi-year double bottom pattern dating to 2018. Some experts project potential targets of $22-$27 if XRP surpasses key resistance levels. The validation of this pattern occurred when XRP crossed above $2 in December 2024.
Market Context and External Factors
Broader cryptocurrency trends influence XRP’s performance. Ethereum maintains leadership with predictions of $4,250 retests. Potential XRP ETF discussions generate optimism but lack concrete developments. Regulatory clarity remains crucial for institutional adoption.
Trading Strategies Amid XRP Golden Cross Uncertainty
Traders should consider multiple indicators beyond moving average crossovers. Monitoring volume trends, institutional activity, and support levels provides better insight. Risk management becomes essential given current market volatility and conflicting signals.
Frequently Asked Questions
What exactly is a golden cross in cryptocurrency trading?
A golden cross occurs when a shorter-term moving average crosses above a longer-term moving average, typically indicating potential bullish momentum.
Why is the XRP golden cross causing debate among traders?
The debate stems from contradictory signals where the golden cross appears alongside declining prices, reduced active addresses, and falling open interest.
What price levels should traders watch for XRP?
Key levels include $2.70 support, $3.09 resistance, and potential targets of $2.08 if support breaks or $3.70 if bullish momentum resumes.
How reliable are golden cross signals in cryptocurrency markets?
While historically significant, golden crosses don’t guarantee outcomes and should be combined with other technical and fundamental analysis.
What long-term potential does XRP show according to analysts?
Some analysts project $22-$27 targets based on double bottom patterns, though current price action remains constrained between $2-$3.60.
How does Ethereum’s performance affect XRP’s price movement?
Ethereum’s market leadership often influences broader cryptocurrency trends, though XRP maintains independent factors including regulatory developments and ecosystem activity.