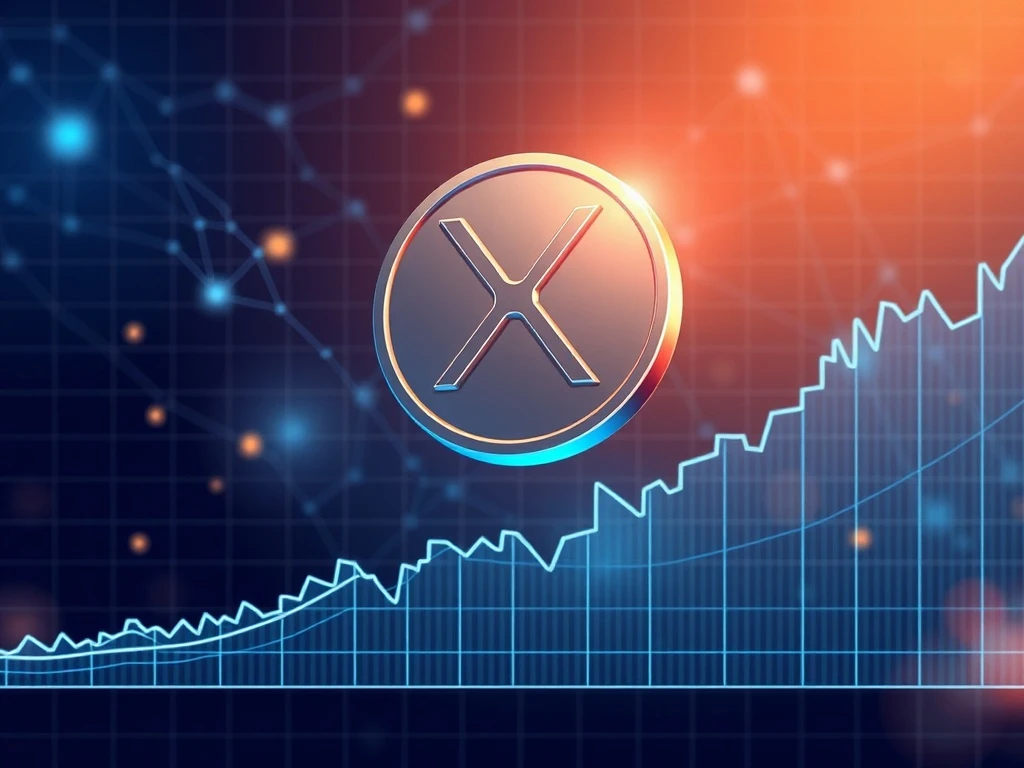
XRP investors are witnessing a critical test of patience as the cryptocurrency consolidates near the $2.70 support level. However, sophisticated on-chain metrics reveal compelling evidence that this consolidation phase may represent a stealth accumulation opportunity rather than a bearish breakdown scenario.
XRP Technical Structure and Support Analysis
XRP has maintained a descending triangle pattern around the $2.70 threshold for 45 consecutive days. This technical formation typically indicates consolidation before a significant price movement. The current price action mirrors historical patterns that preceded substantial XRP breakouts in previous market cycles.
On-Chain Metrics Signal XRP Accumulation
Critical blockchain data points toward underlying strength despite surface-level price stagnation. The Binance leverage ratio has normalized to annual averages, indicating reduced speculative excess. Furthermore, spot cumulative volume delta (CVD) shifts suggest buyer dominance is emerging.
Key on-chain observations include:
- Leverage ratios returning to sustainable levels
- Futures funding rates normalizing to quarterly averages
- Open interest declining from $11B to $7.5B
- $8.41M September inflows reversing August outflows
XRP Price Projections and Technical Targets
Technical analysts identify a fair value gap between $2.35 and $2.65, aligned with Fibonacci retracement levels. This zone represents a potential accumulation area that previously preceded significant XRP advances. Market experts project 60-85% rebound potential by Q4 2025 if current support holds.
Comparative Blockchain Performance Analysis
Despite positive technical signals, XRP faces competitive challenges in blockchain adoption. The XRP Ledger’s $87.85M TVL significantly trails Ethereum’s $96.9B and Solana’s $11.27B. Ripple’s recent infrastructure upgrades aim to address this gap through EVM compatibility and enhanced liquidity pools.
Macroeconomic Factors Influencing XRP
Political developments surrounding potential tax policy changes have introduced additional bullish variables. Proposed tariff-based tax systems could increase market liquidity, potentially benefiting cross-border payment tokens like XRP. These macroeconomic factors combine with technical indicators to create a complex investment landscape.
XRP Investment Outlook and Risk Considerations
While on-chain data suggests accumulation, investors should consider multiple factors. The convergence of technical support, leverage normalization, and macroeconomic conditions creates an intriguing setup. However, the substantial TVL disparity with competing networks remains a fundamental concern for long-term adoption.
Frequently Asked Questions
What is the significance of XRP’s $2.70 support level?
The $2.70 level represents a critical technical support zone where XRP has consolidated for 45 days. This price level aligns with historical support and Fibonacci retracement levels, making it psychologically and technically important.
How do on-chain metrics suggest XRP accumulation?
Normalized leverage ratios, shifting CVD data, and reduced open interest indicate leveraged positions have been cleared. This creates conditions favorable for accumulation without the overhang of excessive speculation.
What time frame are analysts projecting for XRP’s potential rebound?
Most technical analysts project a potential 60-85% move could occur by Q4 2025, assuming current support levels hold and broader market conditions remain favorable.
How does XRP’s TVL compare to other major cryptocurrencies?
XRP’s $87.85M TVL significantly trails Ethereum ($96.9B) and Solana ($11.27B), indicating slower DeFi adoption on the XRP Ledger despite recent infrastructure improvements.
What macroeconomic factors could affect XRP’s price movement?
Potential tax policy changes, regulatory developments, and broader cryptocurrency market sentiment could all significantly impact XRP’s price trajectory in coming months.