Traders witnessed significant XRPUSDT volatility as the pair surged dramatically before facing bearish pressure near critical resistance levels. The 24-hour session revealed crucial technical patterns that every cryptocurrency investor should understand for informed decision-making.
XRPUSDT Price Movement Overview
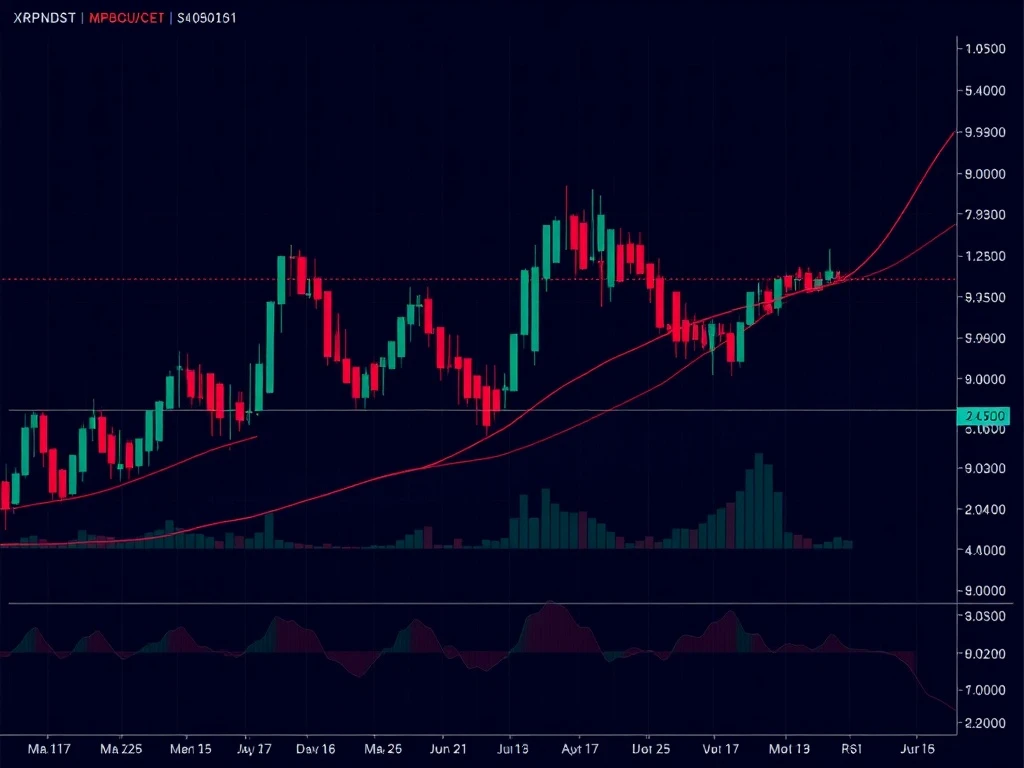
XRPUSDT opened at $2.8148 and experienced a remarkable surge to $2.865 during the session. However, the pair subsequently consolidated near $2.8160, demonstrating clear market indecision. This price action created essential support and resistance levels that traders monitored closely throughout the trading period.
Technical Indicators and XRPUSDT Signals
The MACD indicator turned negative while RSI showed overbought divergence, signaling potential bearish reversal. These technical developments occurred after the mid-session rally, suggesting exhaustion in buying momentum. Additionally, Bollinger Band expansion indicated increased volatility throughout the session.
Volume Analysis and Market Sentiment
Volume spiked to 1.67 million units at the $2.865 peak but faded significantly in later hours. This volume pattern indicates weakening bullish conviction and suggests possible short-term bottoming. Total traded volume reached approximately 14.8 million units with $41.4 million notional turnover.
Critical Support and Resistance Levels
Key Fibonacci levels at $2.8300 and $2.8140 acted as critical pivots during the session. The 15-minute chart showed strong support at $2.8140–2.8150, while resistance formed near $2.8250–2.8300. These levels provide crucial reference points for future price movements.
Trading Strategies for XRPUSDT
Backtest strategies focus on breakout and reversal patterns around identified key levels. A long entry triggers on confirmed close above $2.8258 with volume confirmation, targeting $2.8450. Conversely, short setups initiate on retest of the $2.8140–2.8150 support zone with bearish divergence confirmation.
Market Outlook and Future Projections
The session concluded with price sitting slightly above the 20-period Bollinger middle band, indicating potential consolidation ahead. However, the mixed signals suggest possible breakout triggers if the upper band retests. Traders should monitor volume confirmation for sustained moves.
Frequently Asked Questions
What caused XRPUSDT’s price surge to $2.865?
The surge resulted from strong bullish momentum and breakout above prior resistance at $2.8374, confirmed by volume spikes and technical indicators.
Why did XRPUSDT face bearish pressure later?
Profit-taking emerged after the rally, coupled with MACD turning negative and RSI showing overbought divergence, indicating exhausted buying pressure.
What are the key support levels for XRPUSDT?
Critical support resides at $2.8140–2.8150 and $2.8060–2.8080, with Fibonacci levels providing additional important reference points.
How does volume affect XRPUSDT price movements?
Volume confirmation validates price movements, with declining volume during price drops suggesting weakening conviction and potential bottoming processes.
What trading strategies work best for XRPUSDT currently?
Breakout strategies above $2.8258 or reversal plays at support levels with proper risk management below $2.8060 prove most effective.
Which technical indicators are most reliable for XRPUSDT analysis?
MACD crossovers, RSI divergence, and Bollinger Band interactions provide reliable signals when combined with volume confirmation and key level analysis.