The cryptocurrency market, known for its rapid shifts, currently presents a critical juncture for **XRP price**. Investors and traders are closely watching as XRP faces mounting pressure, with a pivotal support level at $2.65 determining its immediate future. Will this digital asset stage a recovery, or is a more significant correction on the horizon? This comprehensive analysis delves into the technical indicators and on-chain data influencing XRP’s trajectory.
Understanding the Current XRP Price Landscape
After a notable rally, the **XRP price** soared to a yearly high of $3.65 on July 18. However, it has since undergone a sharp correction, dropping nearly 19% in three weeks. This significant pullback has left many wondering about its next move. Currently, XRP struggles to reclaim the crucial $3.10–$3.00 resistance zone. On Saturday, prices briefly dipped to a key support range between $2.66 and $2.80. Nevertheless, a subsequent bounce on Sunday formed a higher low, offering a glimmer of hope for buyers.
The market remains highly volatile. Traders are carefully monitoring these price movements for definitive signs of either recovery or continued decline. Understanding these key levels is paramount for anyone invested in XRP.
XRP one-day chart analysis. Source: StockPil/TradingView
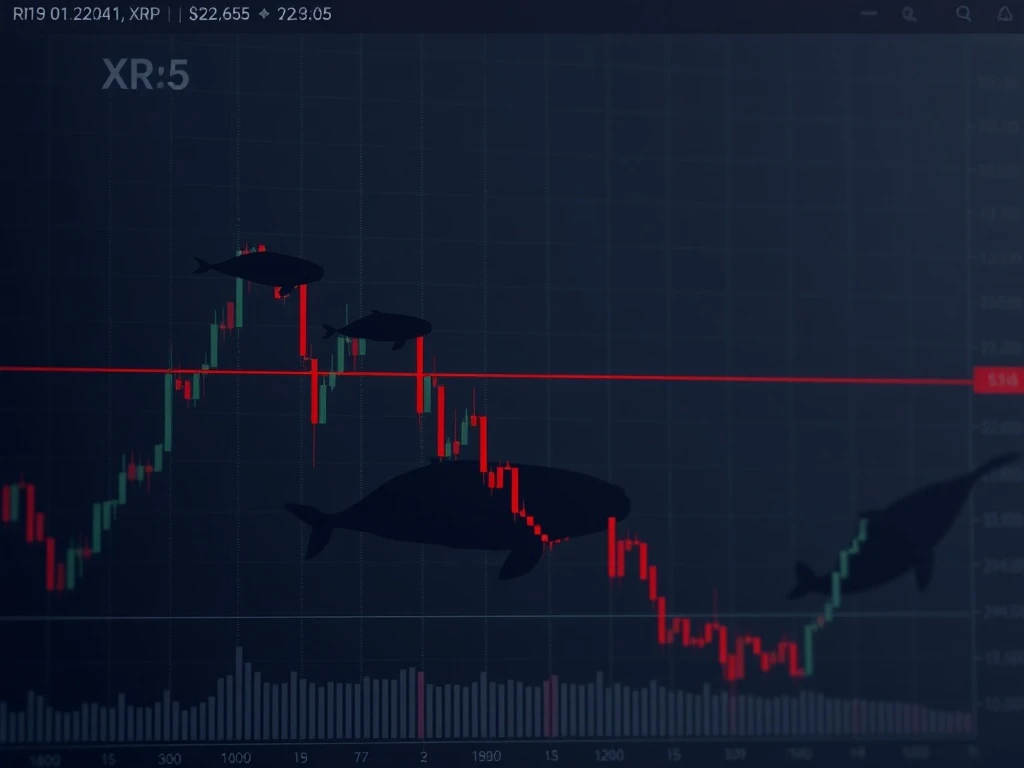
Whale Activity Driving Pressure on XRP Price
Data from CryptoQuant indicates that large holders, often referred to as ‘whales,’ are significantly influencing the current retracement. These entities, holding substantial amounts of XRP, have been steadily offloading their positions. Specifically, between July 9 and August 5, the 90-day moving average of whale netflows shows a negative 640 million XRP. This amount, valued at approximately $340 million, suggests sustained distribution pressure. Consequently, this selling activity directly coincides with the recent price slump, exacerbating the downward trend for **XRP price**.
Whale movements often precede significant price shifts. Their large transactions can easily absorb market liquidity, pushing prices lower. Therefore, monitoring these netflows provides crucial insight into potential future price action. A continued negative trend in whale netflows could signal further downside pressure on XRP.
XRP Whale Flow 30-day moving average. Source: CryptoQuant
The Critical $2.65 Support Level for XRP
The $2.65 level holds immense importance for the bullish market structure of XRP. Historically, this level acted as significant resistance throughout the first half of 2025. After finally breaking above it in July, it effectively flipped into strong support. This technical shift in structure is a common occurrence in market analysis. A sustained hold above this level is absolutely essential to preserve the uptrend narrative for the **XRP price**. Conversely, a breach could signal a deeper correction.
Crypto analyst Dom highlights that XRP managed to retain $2.80, a key initial area of interest. Crucially, it currently steers clear of $2.65, which aligns with the quarterly Volume-Weighted Average Price (VWAP). VWAP represents the average price of an asset traded over a period, weighted by volume. Traders frequently use it to assess fair value. Dom cautions that any move below this zone would severely damage the chart. Such a move could potentially invalidate short-term bullish continuation setups, shifting the market sentiment significantly.
XRP one-day chart. Source: StockPil/TradingView
Expert Perspectives on XRP Price Trajectory
Prominent crypto trader Nebraskangooner analyzes XRP’s daily chart. He suggests the altcoin could face a “full pump retrace.” This scenario implies that prices could revisit the base of the previous rally, potentially retesting the $2 mark. Such a move would effectively erase months of gains. Therefore, the $2.65 level is a crucial line in the sand for the **XRP price** to maintain its bullish momentum.
Additionally, technical analyst Mind Trader provides further insights. He notes that XRP has completed a 50% Fibonacci retracement from its $3.65 high. Historically, if the 50% level holds, a renewed push could target $4.15, potentially establishing a new all-time high. However, if XRP breaks below $2.65, it risks slipping back into its previous range. This could lead to a retest of $2, essentially undoing recent gains and signaling broader market weakness. These expert opinions underscore the critical nature of the current market juncture for XRP.
XRP one-day analysis by Dom. Source: X
Navigating the Volatility: What’s Next for XRP Price?
The current market environment for XRP is undoubtedly tense. The confluence of whale selling pressure and critical technical levels creates a challenging outlook. The $2.65 support level stands as the most important benchmark for the **XRP price**. A successful defense of this level could pave the way for a renewed uptrend, potentially targeting new highs as suggested by some analysts. Conversely, a failure to hold this support could trigger a deeper correction, potentially revisiting the $2 mark and undoing recent progress.
Investors should exercise caution and conduct thorough research. The cryptocurrency market is inherently unpredictable, and significant price swings are common. Monitoring whale activity, key support and resistance levels, and broader market sentiment will be crucial for understanding XRP’s path forward.
This article does not contain investment advice or recommendations. Every investment and trading move involves risk, and readers should conduct their own research when making a decision.
Frequently Asked Questions (FAQs)
What does ‘full pump retrace’ mean for XRP price?
A ‘full pump retrace’ suggests that the **XRP price** could fall back to the level where its previous significant rally began. In this context, analysts indicate a potential return to the $2 mark, which would effectively undo recent gains and signify a complete reversal of the previous upward movement.
Why is the $2.65 level so important for XRP?
The $2.65 level is critical because it acts as a confluence of significant technical indicators. It previously served as strong resistance and has now flipped to support. Furthermore, it aligns with the quarterly Volume-Weighted Average Price (VWAP) and the 0.50 Fibonacci retracement level. Holding this level is crucial for maintaining XRP’s bullish market structure.
How do whale movements affect the XRP price?
Whales are large holders of XRP. When they offload significant amounts of tokens, it increases selling pressure in the market. This increased supply, coupled with demand, can drive the **XRP price** down. Conversely, whale accumulation can signal potential upward price movement.
What are the potential price targets for XRP if $2.65 holds?
If the **XRP price** successfully holds the $2.65 support, some analysts suggest a potential renewed push. Specifically, the 0.50 Fibonacci retracement holding could lead to a target of $4.15, which would represent a new all-time high for XRP.
What happens if XRP price breaks below $2.65?
If XRP breaks below $2.65, it risks slipping back into its previous trading range. This could lead to a retest of the $2 level, effectively undoing months of gains. Such a move would signal broader weakness in the market and could invalidate short-term bullish setups, prompting further downside potential for the **XRP price**.